Understanding the metrics in your report
Overview
Each project you run on Zappi will produce a robust set of charts and analysis based on key metrics of the methodology. As you explore your results, you may have questions about what each metric is composed of in order to gauge their full impact and relay it to stakeholders. You can find a brief explanation of metrics in the Notes section accompanying each chart, whether on-platform or when viewing in an export format.
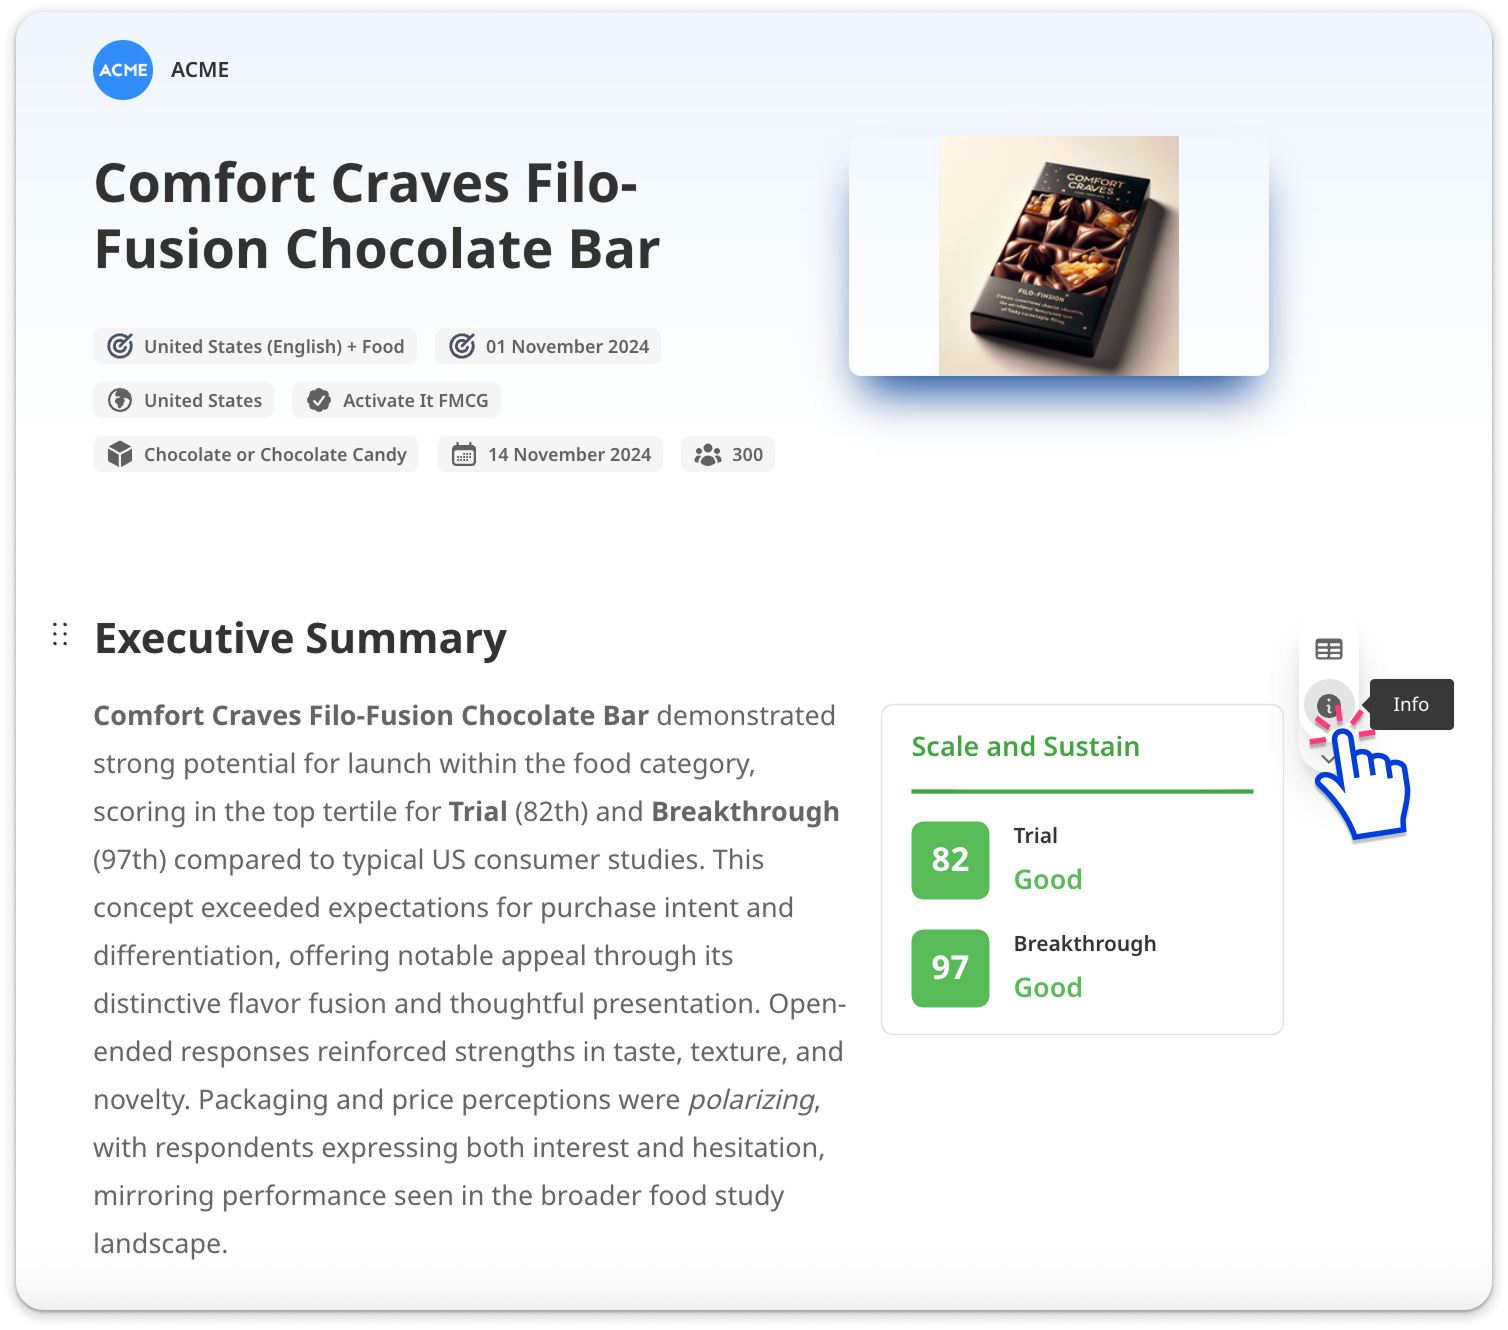
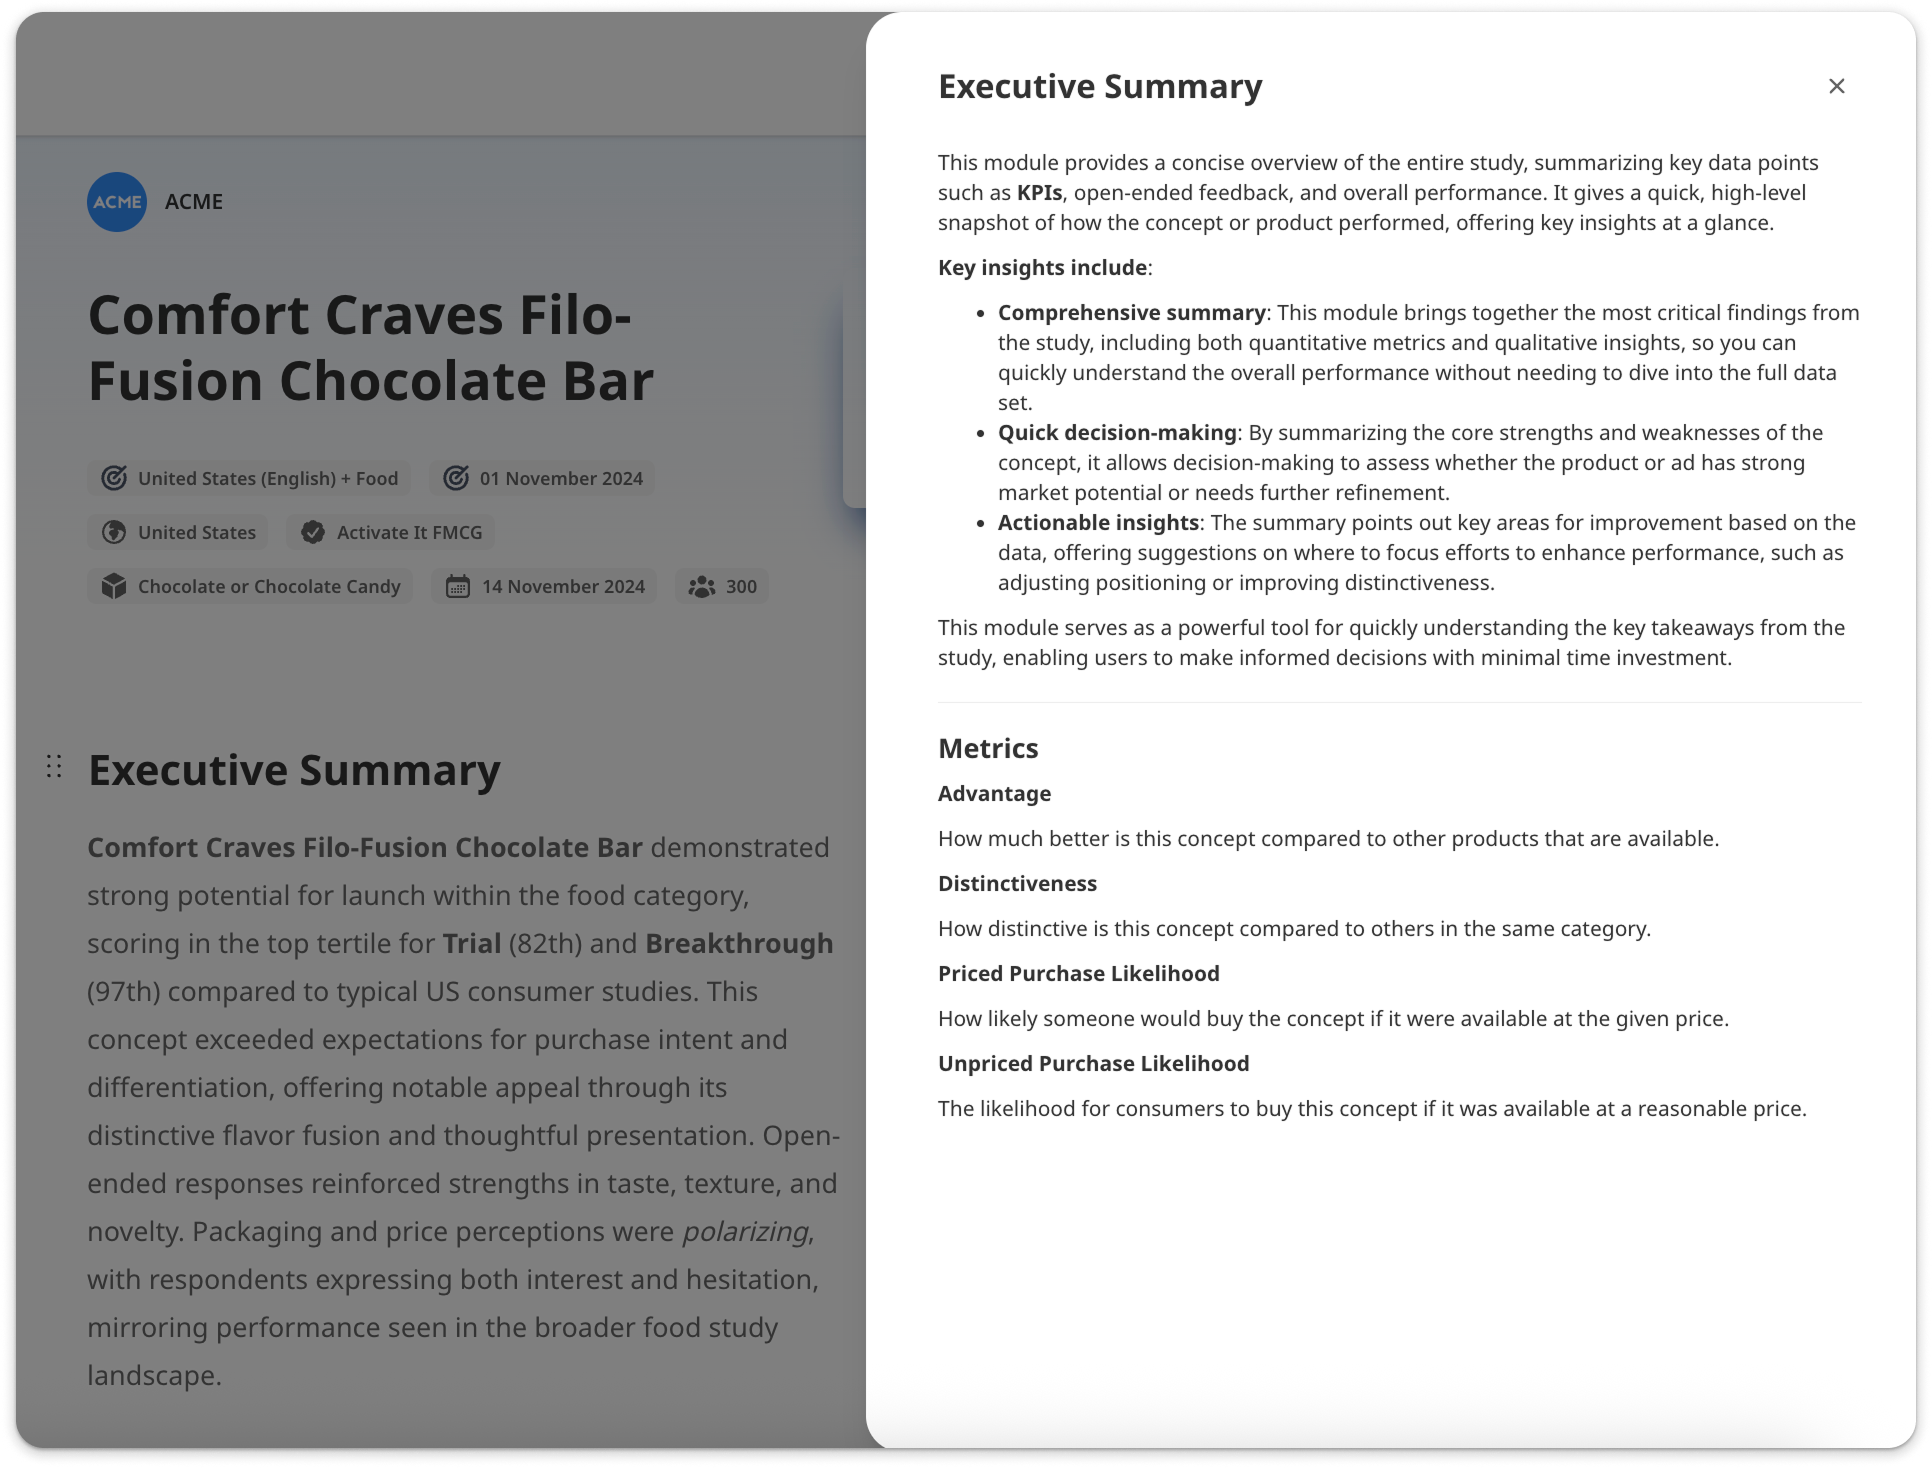
AI Quick Reports
Hover over a section in your quick report and find the 'info' button on the right.
Click it to open the details about that section.
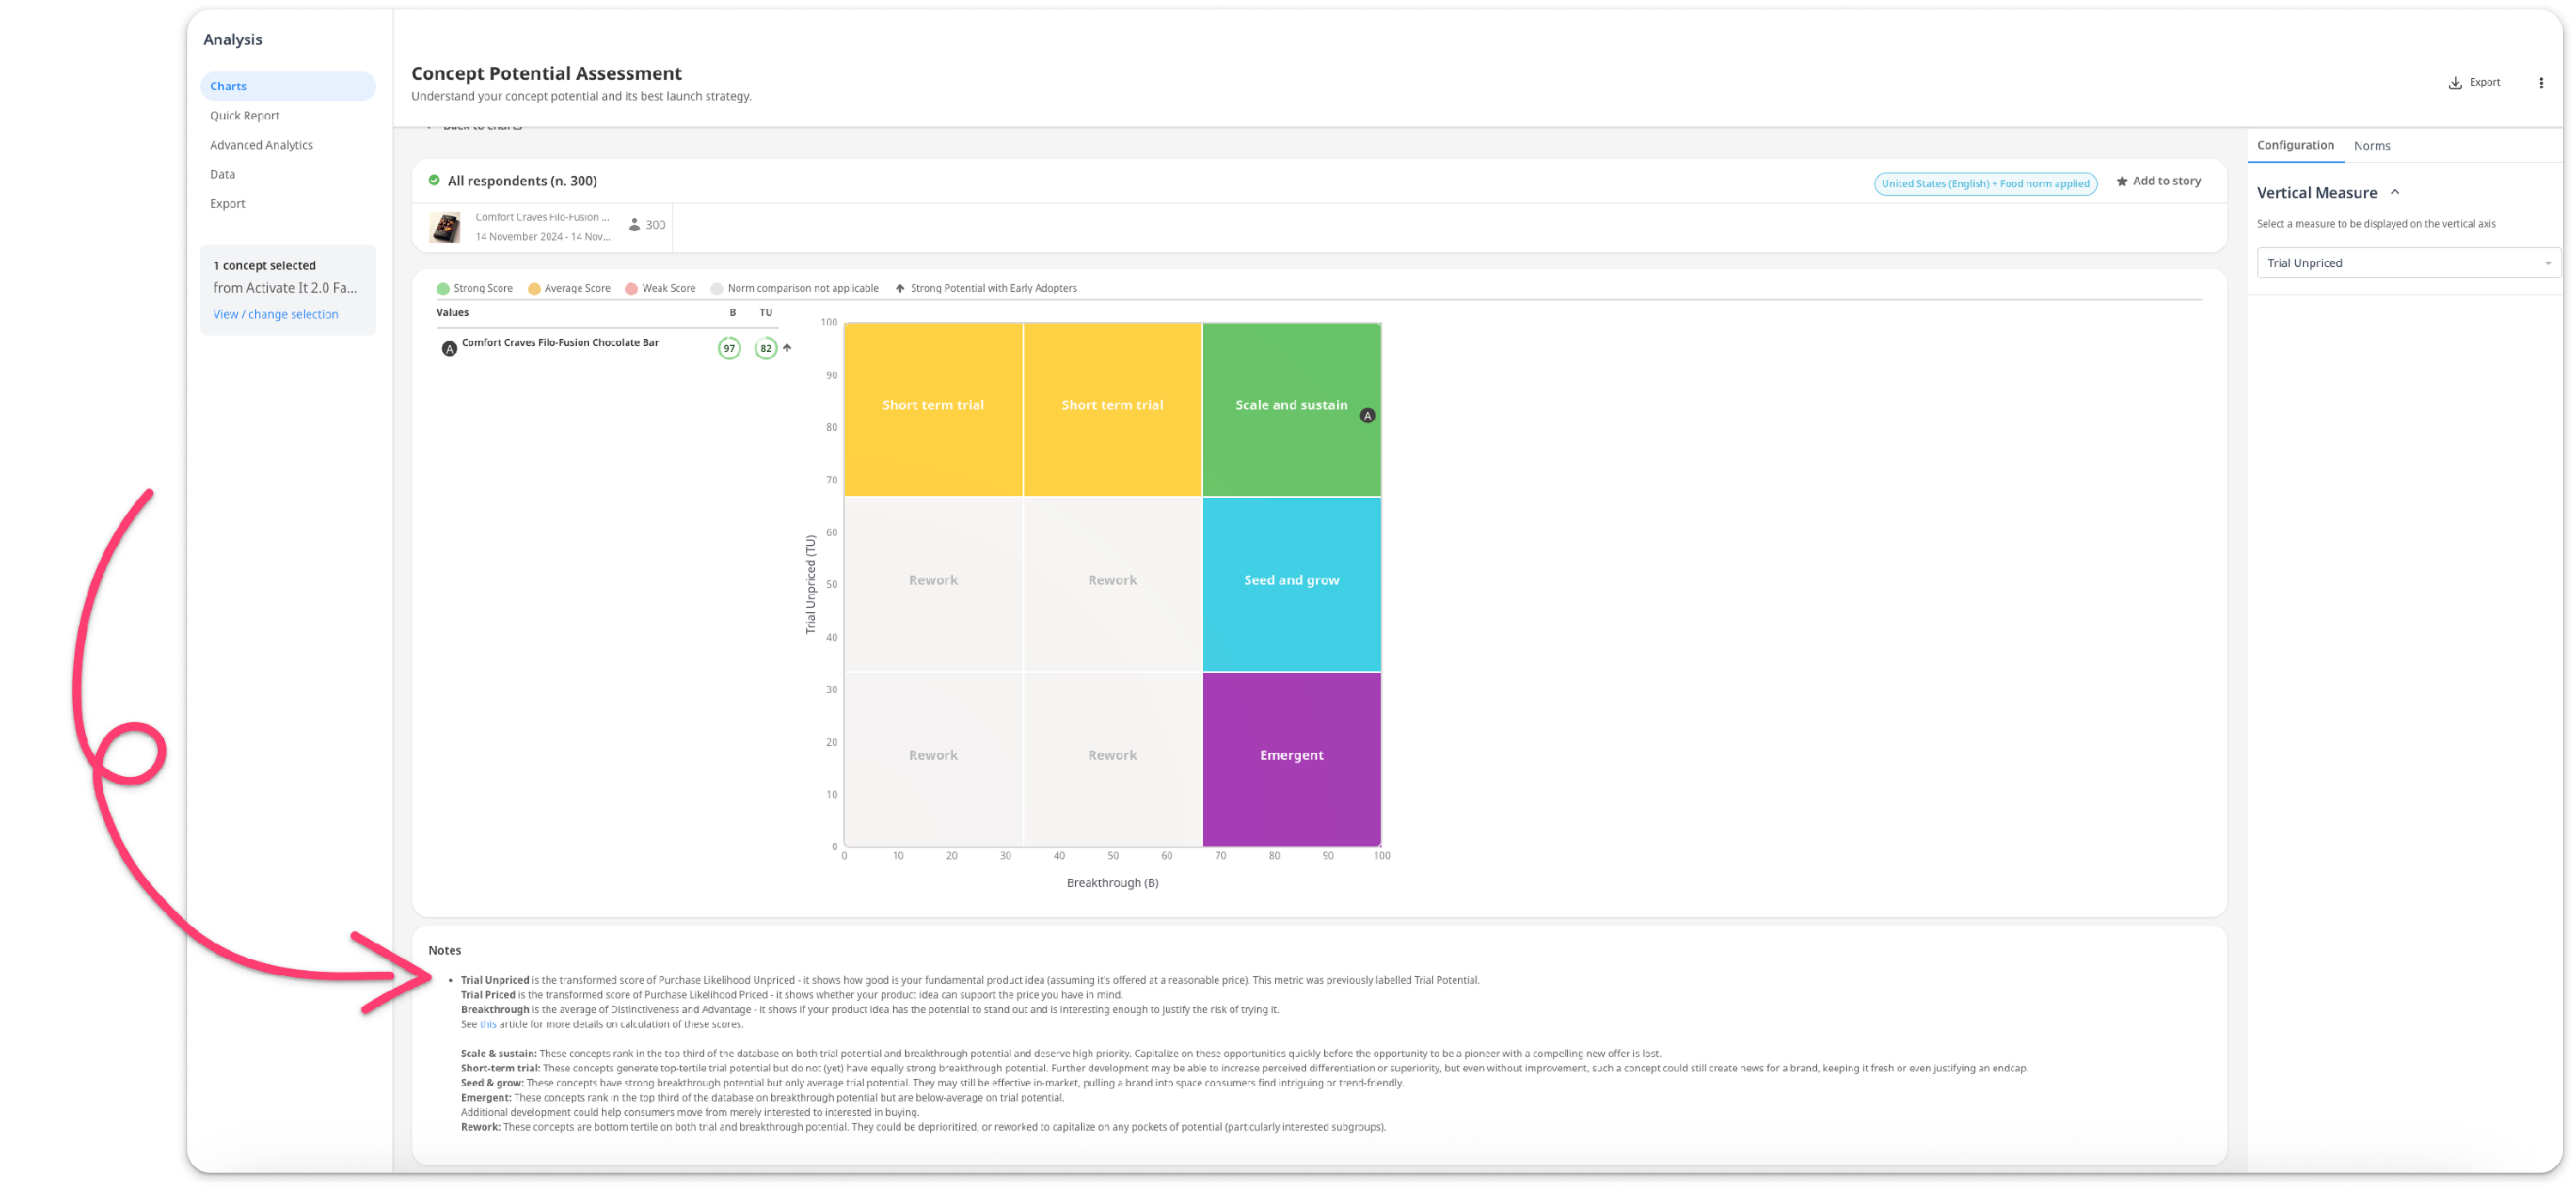
Charts
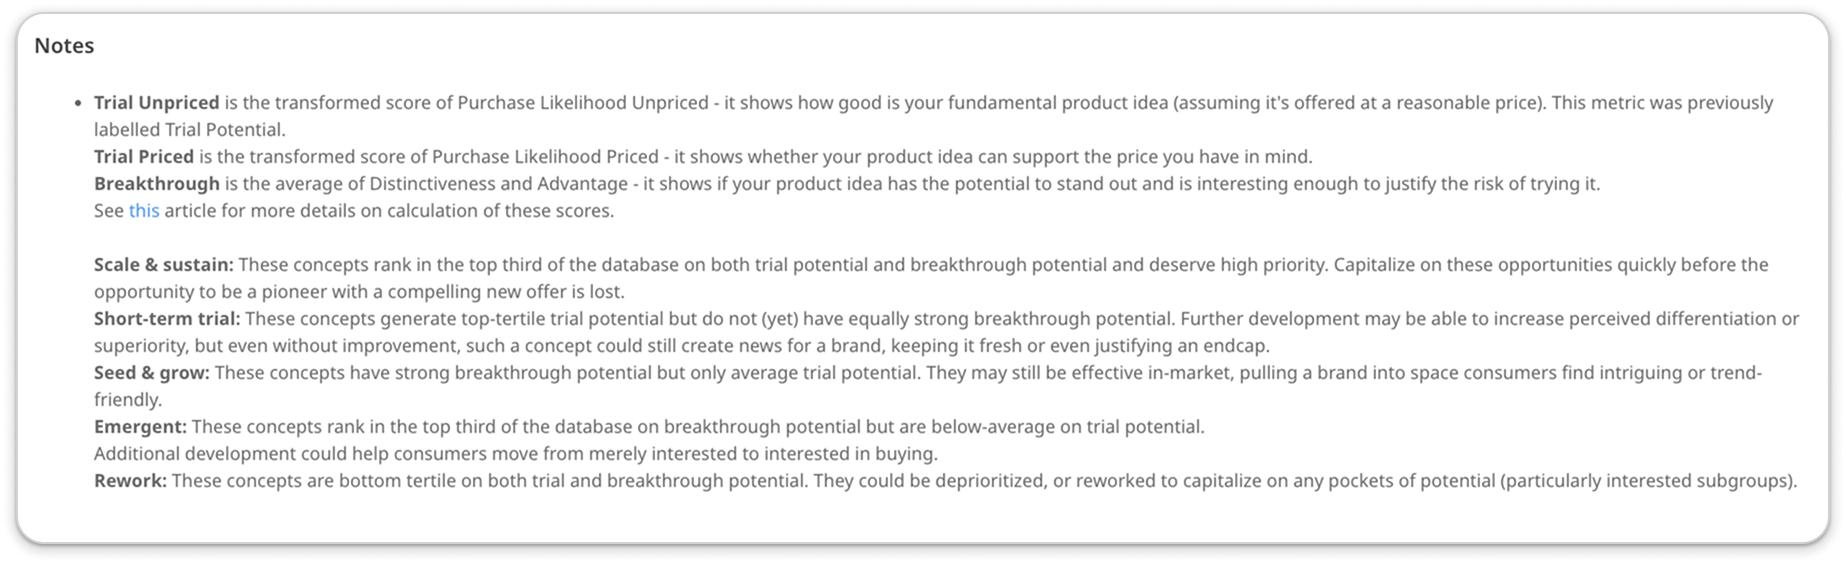
Scroll down on any chart page until you locate the Notes section. In the example below, the text describes an aggregate measure that the platform has calculated automatically, as well as the measures it is composed of.
Exports
You can find the same text following the chart in any export format (.pptx, .pdf, etc.).