Filters
What is filtering for?
It's the case for many research projects that to answer all your business questions you need to look at how respondents with different attributes or attitudes responded to your survey. This is called filtering your data.
When you first open a report, the platform will show you the KPIs and other automated reporting that are most important to your business question. The report will default to showing you the aggregate of everyone who answered the survey. While it's a best practice to look first at the results in aggregate, it's very common to have more targeted questions about subgroups. For example, you may ask how your study results differ by the respondents':
- Region
- Age
- Gender
- Purchase behavior (i.e., those who purchase from your category most often)
- Attitudes about your stimulus (i.e., those who especially liked your stimulus, often referred to as those in the "top two box")
- Answers to custom questions you included
By filtering to see how different subgroups responded to your survey, you may find opportunities or risks obscured by the aggregate results, that help give you and your teams much clearer guidance on how to move forward, with whom, and what's at stake.
How do I find and apply filters in Zappi?
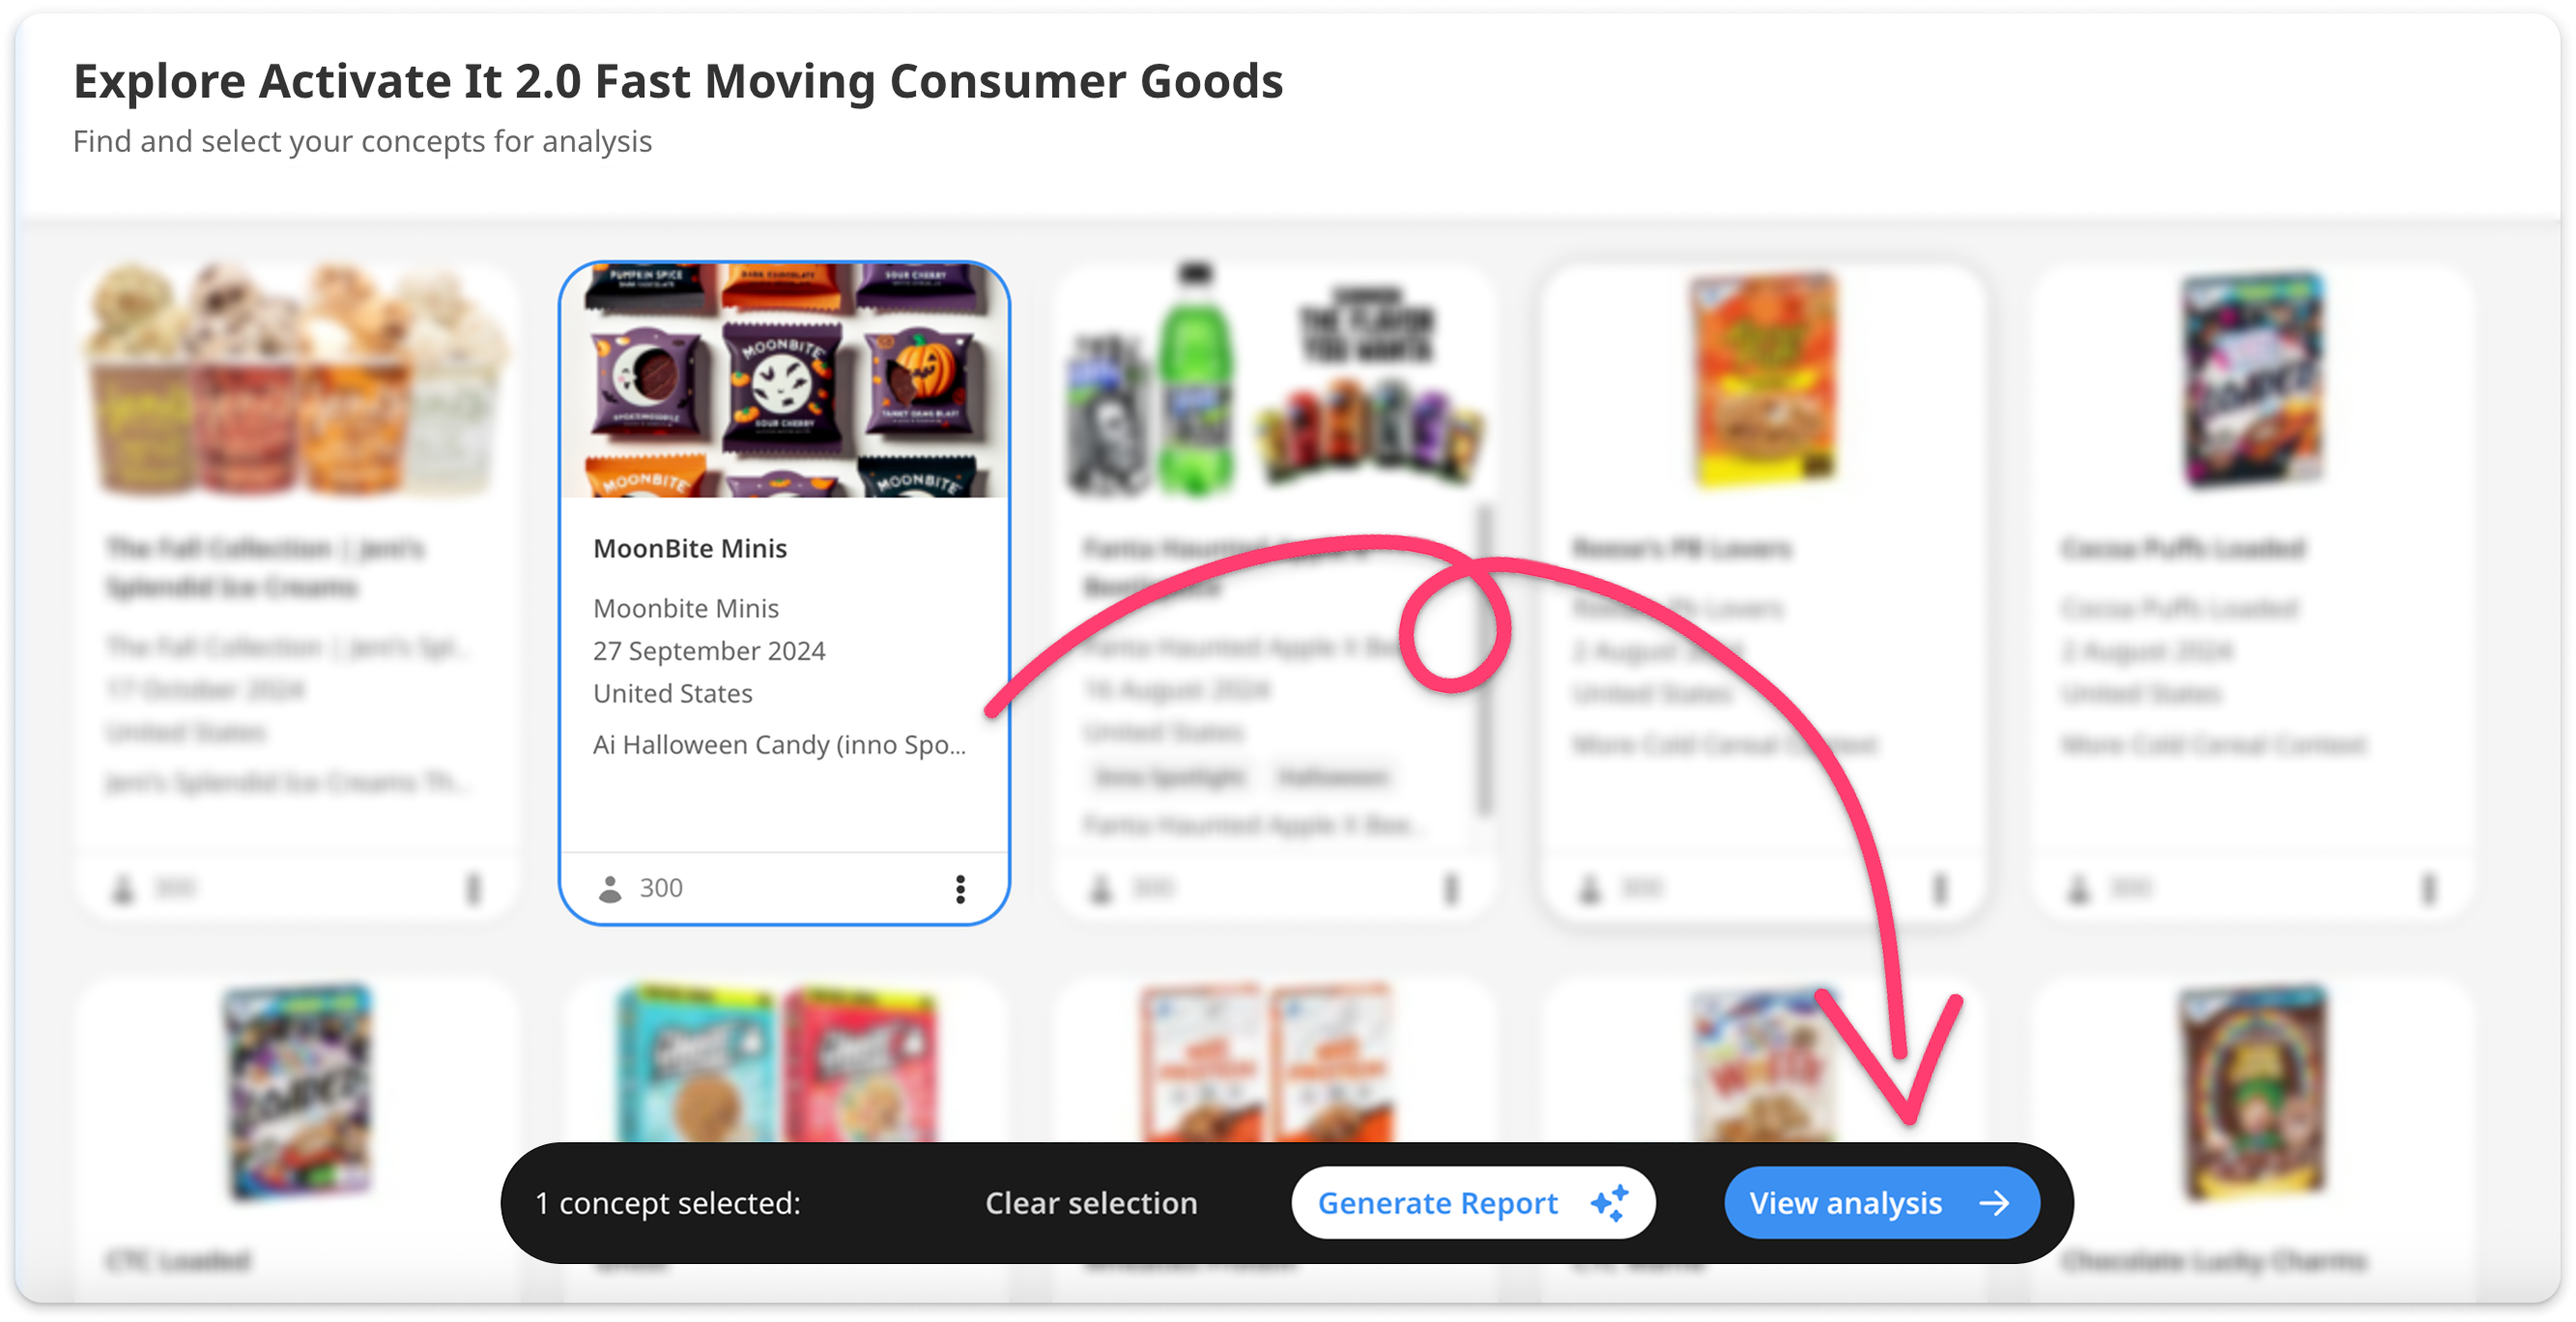
1. Locate the report you'd like to filter. Do this by going to the "Analysis" tab on the sidebar. Locate the tool you used to run the survey and then select the project. Click on the "View analysis" button that will appear at the bottom.
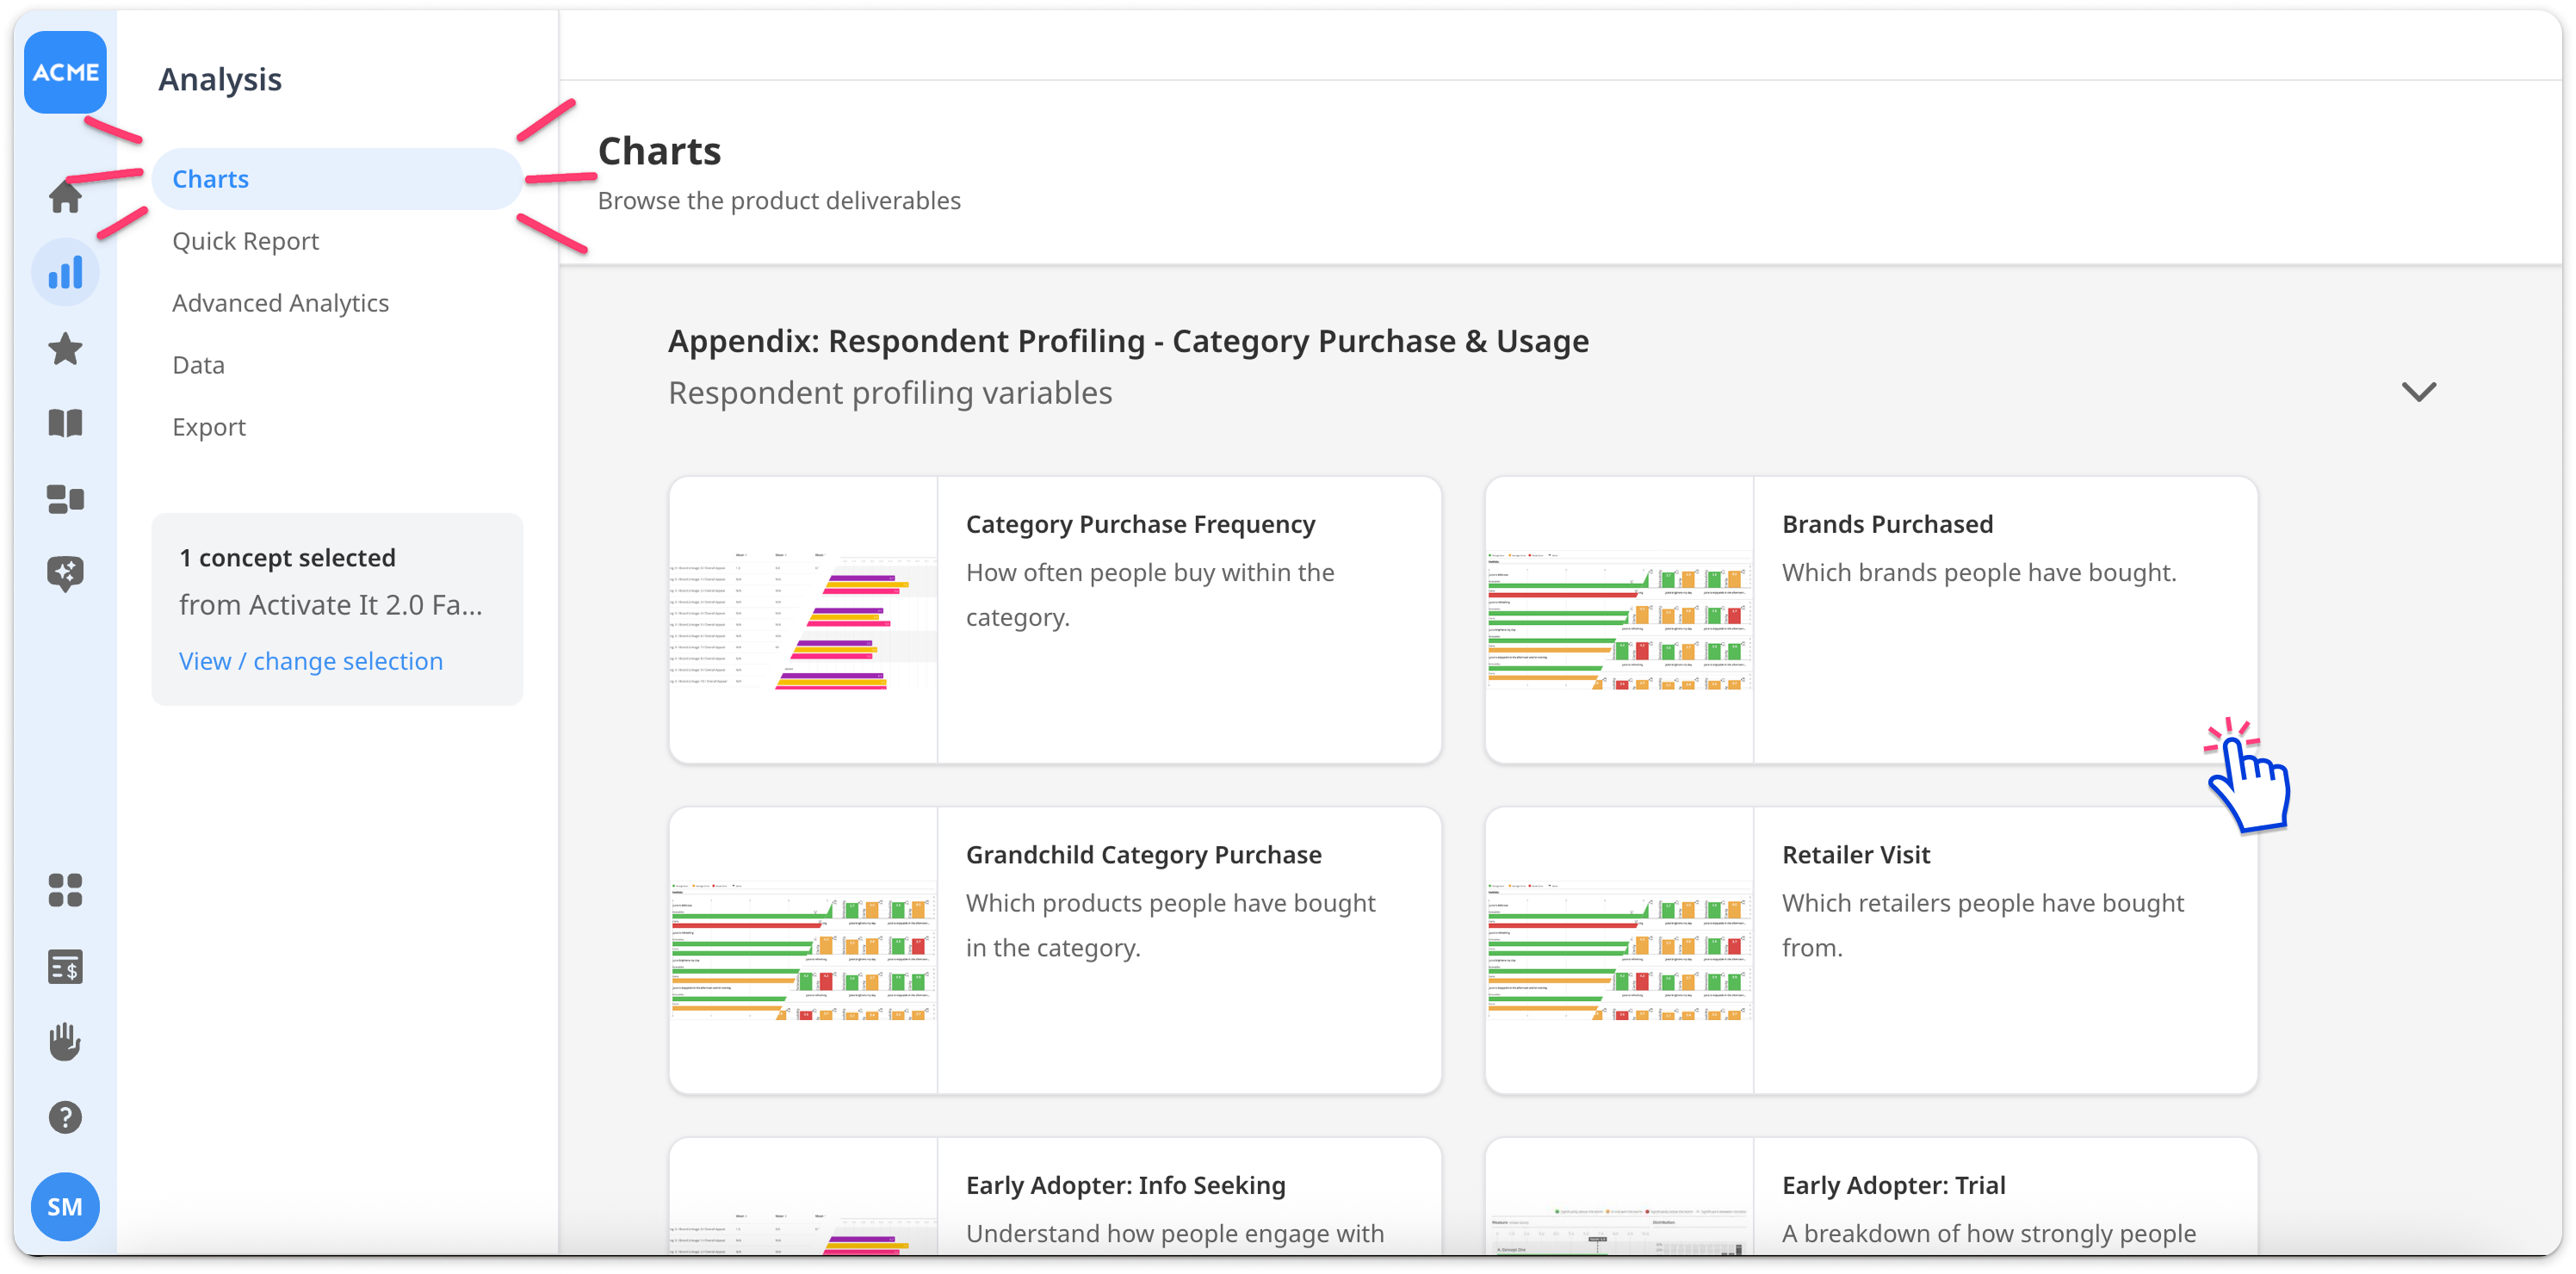
2. Select the Charts tab from the left menu. you can browse a selection of charts, each accompanied by a brief description explaining its insights. Select the chart you’re interested in.
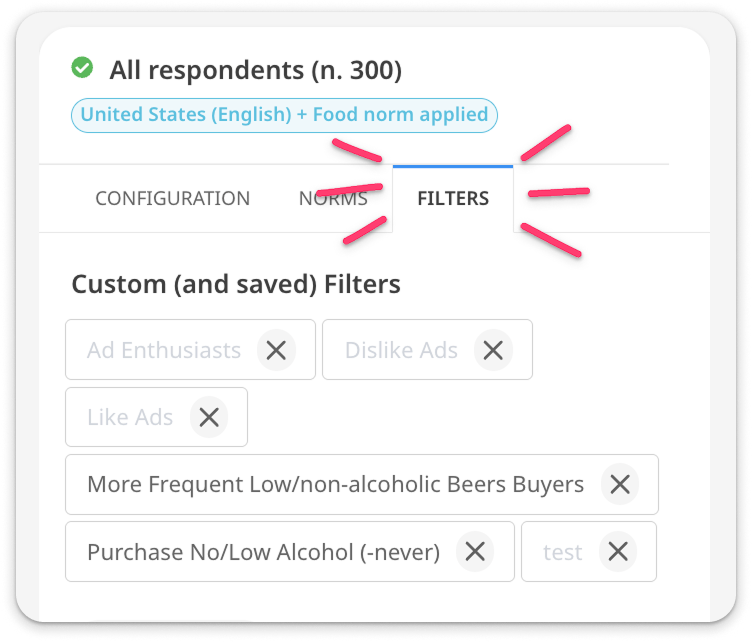
3. Once the chart is open, select the 'Filters' tab on the sidebar.
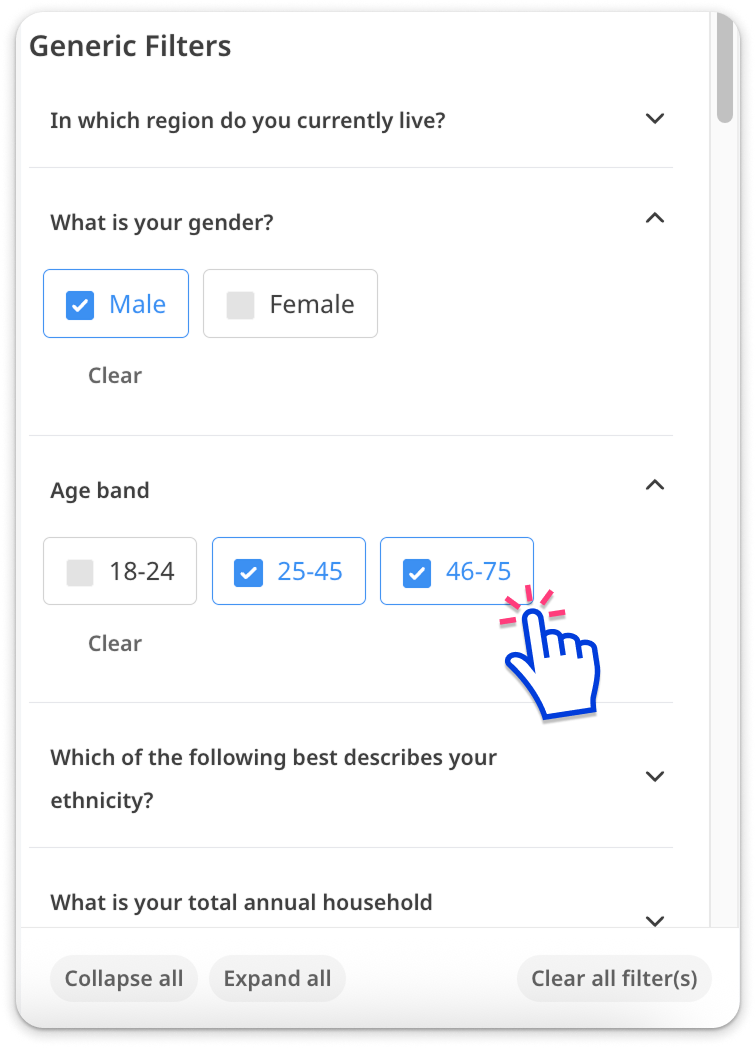
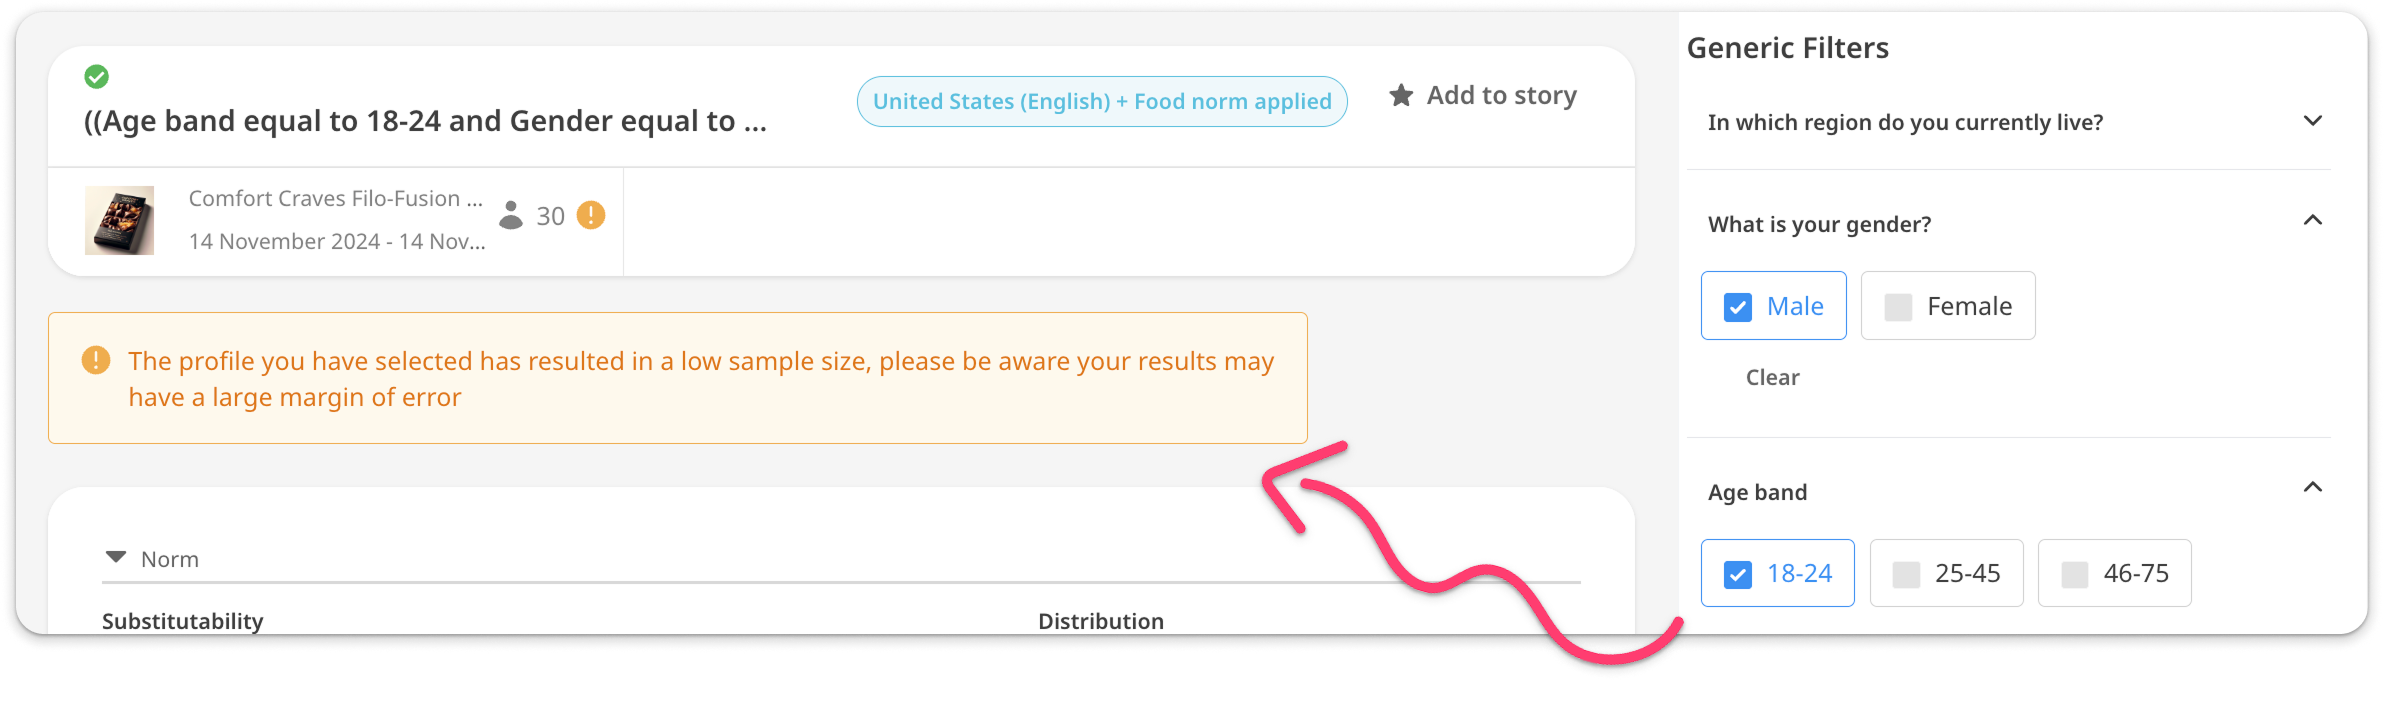
4. Explore your filters! The available options will depend on which tool you've used and what custom questions you included. Generally speaking, the first filters listed are from the survey's screening portion, followed by measures or attitudes asked for in the main survey, followed by your custom questions. Expand the filter you'd like to apply and select options to include in your analysis.
Low Base Size Warning
As you adjust your filters, the base size reflected in your analysis will drop. Take caution with conclusions drawn based on small numbers of people.
A warning will appear when the base size drops below a reliability threshold.
How do I add custom filters?
You can create custom filters (and custom, user-defined norms) within the "Filters” tab on the right-hand sidebar.
Click on the "Create new" button to get started. The "Advanced Filter Builder" will appear, where you can create, save and apply a custom filter to your chart.

Note: When you add a new condition, “ALL” means all X AND Y criteria must be met; and “ANY” means X OR Y criteria must be met.
You can also look at subgroups using Profiles.