Grid Style Questions
How Zappi displays grid questions
Online market research has long grappled with the challenge of grid questions, which often result in an unsatisfactory user experience and a tendency for respondents to provide low-quality answers. This problem is exacerbated when surveys are accessed via mobile devices. At Zappi, we prioritize a mobile-first approach in our survey designs, aiming for consistency across mobile and desktop platforms wherever feasible.
Our data shows that 74% of Zappi respondents access surveys on mobile devices, while the remaining 26% use desktops.
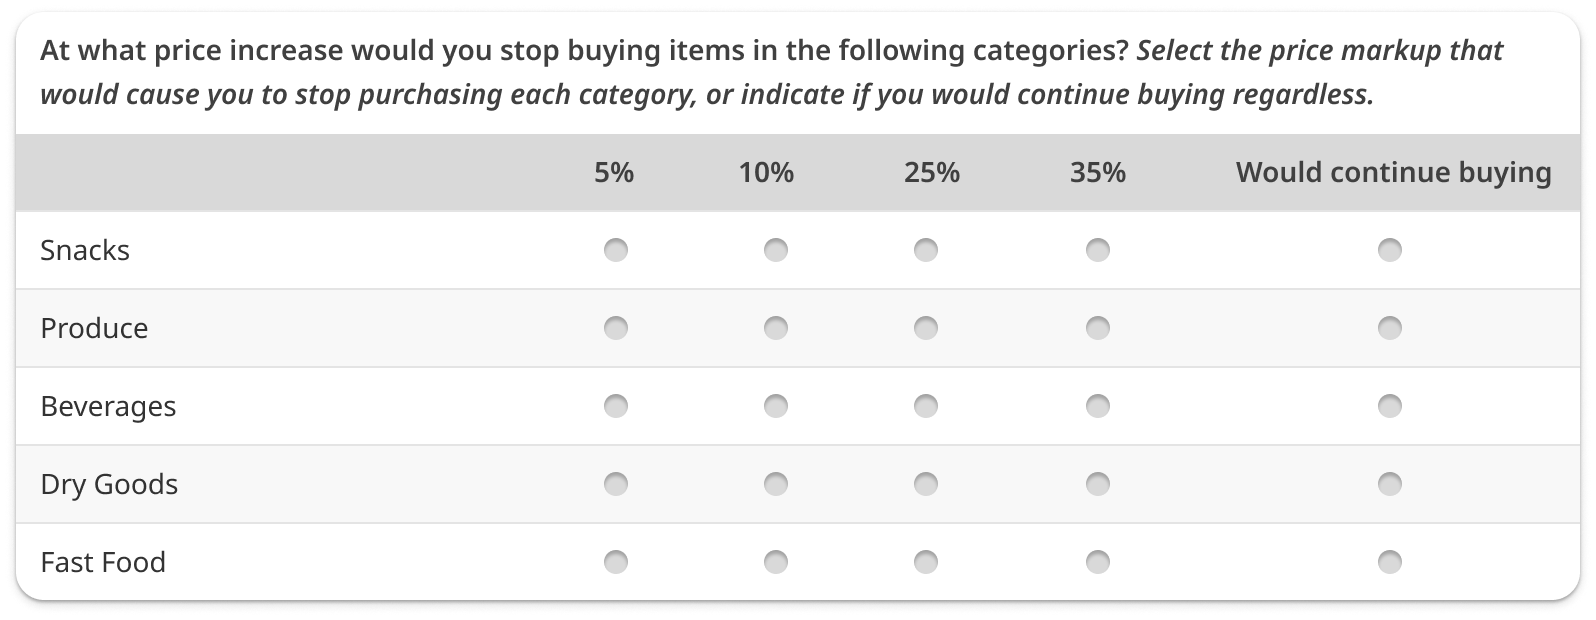
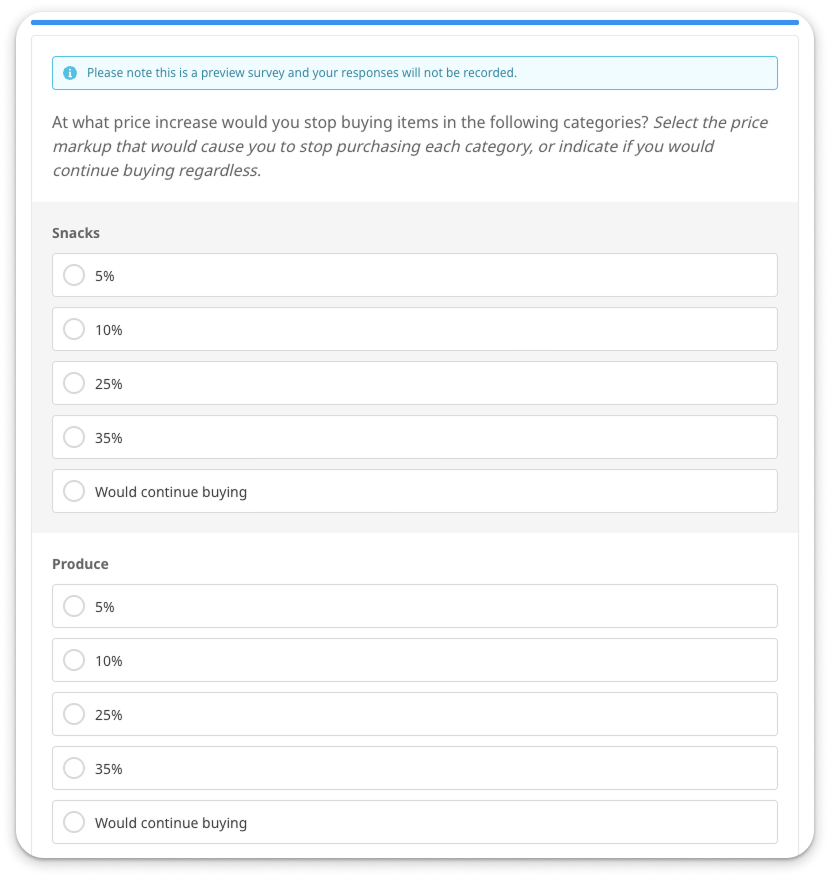
| Traditional Grid | List Grid |
|
|
|
This demographic distribution, along with our strategic implementation of rules for switching between list and traditional grids, means that we rarely resort to using traditional grids.
There are several compelling reasons for favoring list grids over traditional grids:
- Enhanced User Experience: List grids offer a far superior user experience on mobile devices, which translates to higher respondent engagement and reduced dropout rates. This consistent user experience extends to larger screens as well.
- Reduced Response Bias: Displaying questions in a vertically stacked manner discourages respondents from "straight lining" or creating response patterns without thoughtful consideration.
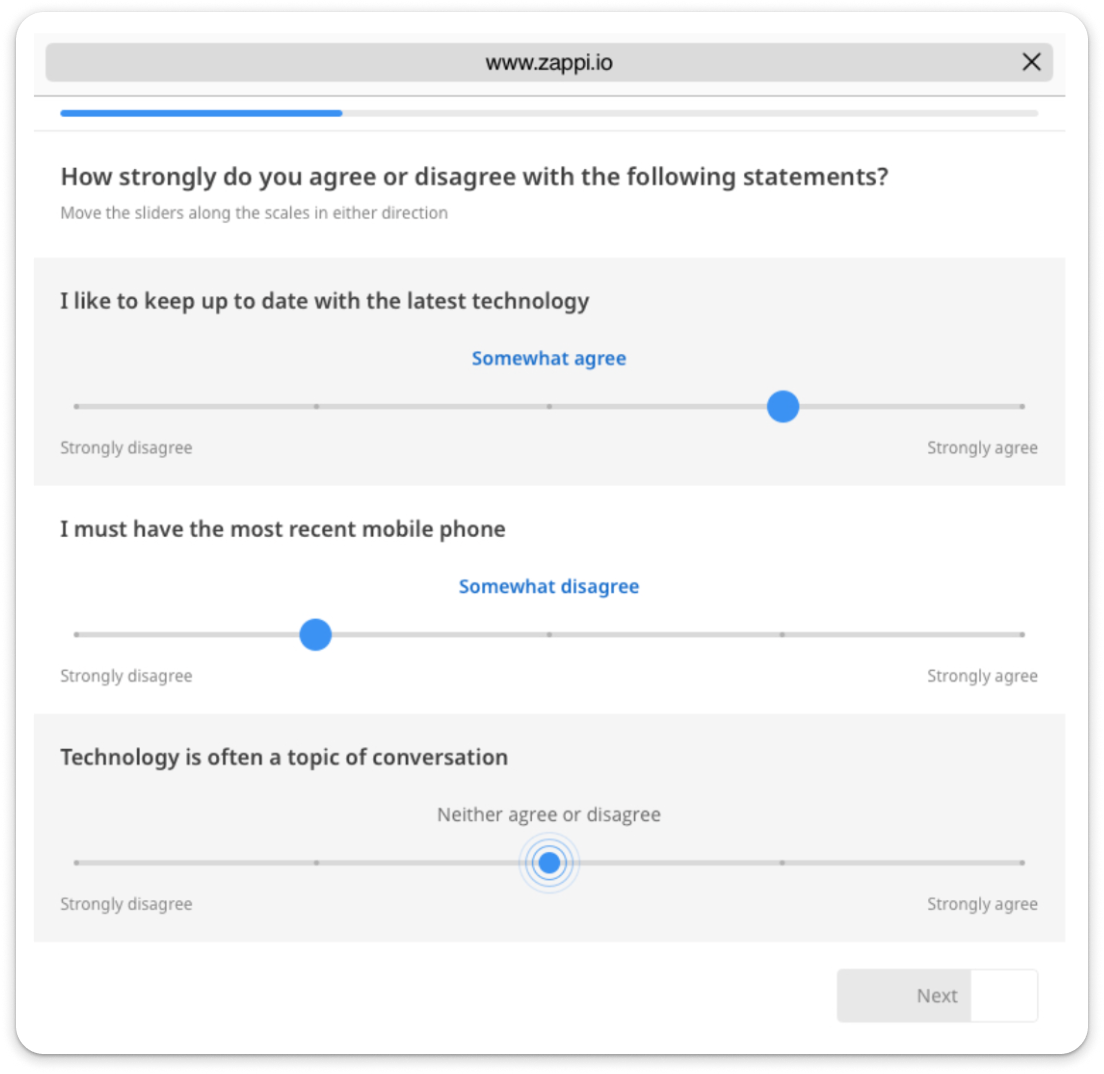
- Cross-Platform Consistency: The vertically stacked design remains consistent across various platforms, whether mobile, tablet, or desktop, and is adaptable to different question types such as single choice, multiple choice, and emoji response.
- Adaptability to Text Length: With vertically stacked designs, any amount of text can be accommodated without issues, unlike traditional grids, which can lead to truncated text and confusion over which answer corresponds to which question.
- Language and Question Type Flexibility: Traditional grids can cause inconsistencies due to language differences or variations in grid questions within the same survey. Our vertically stacked design avoids these pitfalls, ensuring a uniform experience.
To ensure data consistency despite changes in question formats, we conducted thorough side-by-side studies, comparing scalar and categorical grid questions. Our analysis encompassed 178 comparisons, revealing no significant differences in 96% of the cases. This finding aligns with the consistency expected from running identical studies, reinforcing our confidence that transitioning to list grids will not adversely impact data quality.
By embracing list grids, we are not only enhancing the respondent experience but also maintaining the integrity and consistency of our data across diverse platforms and languages.
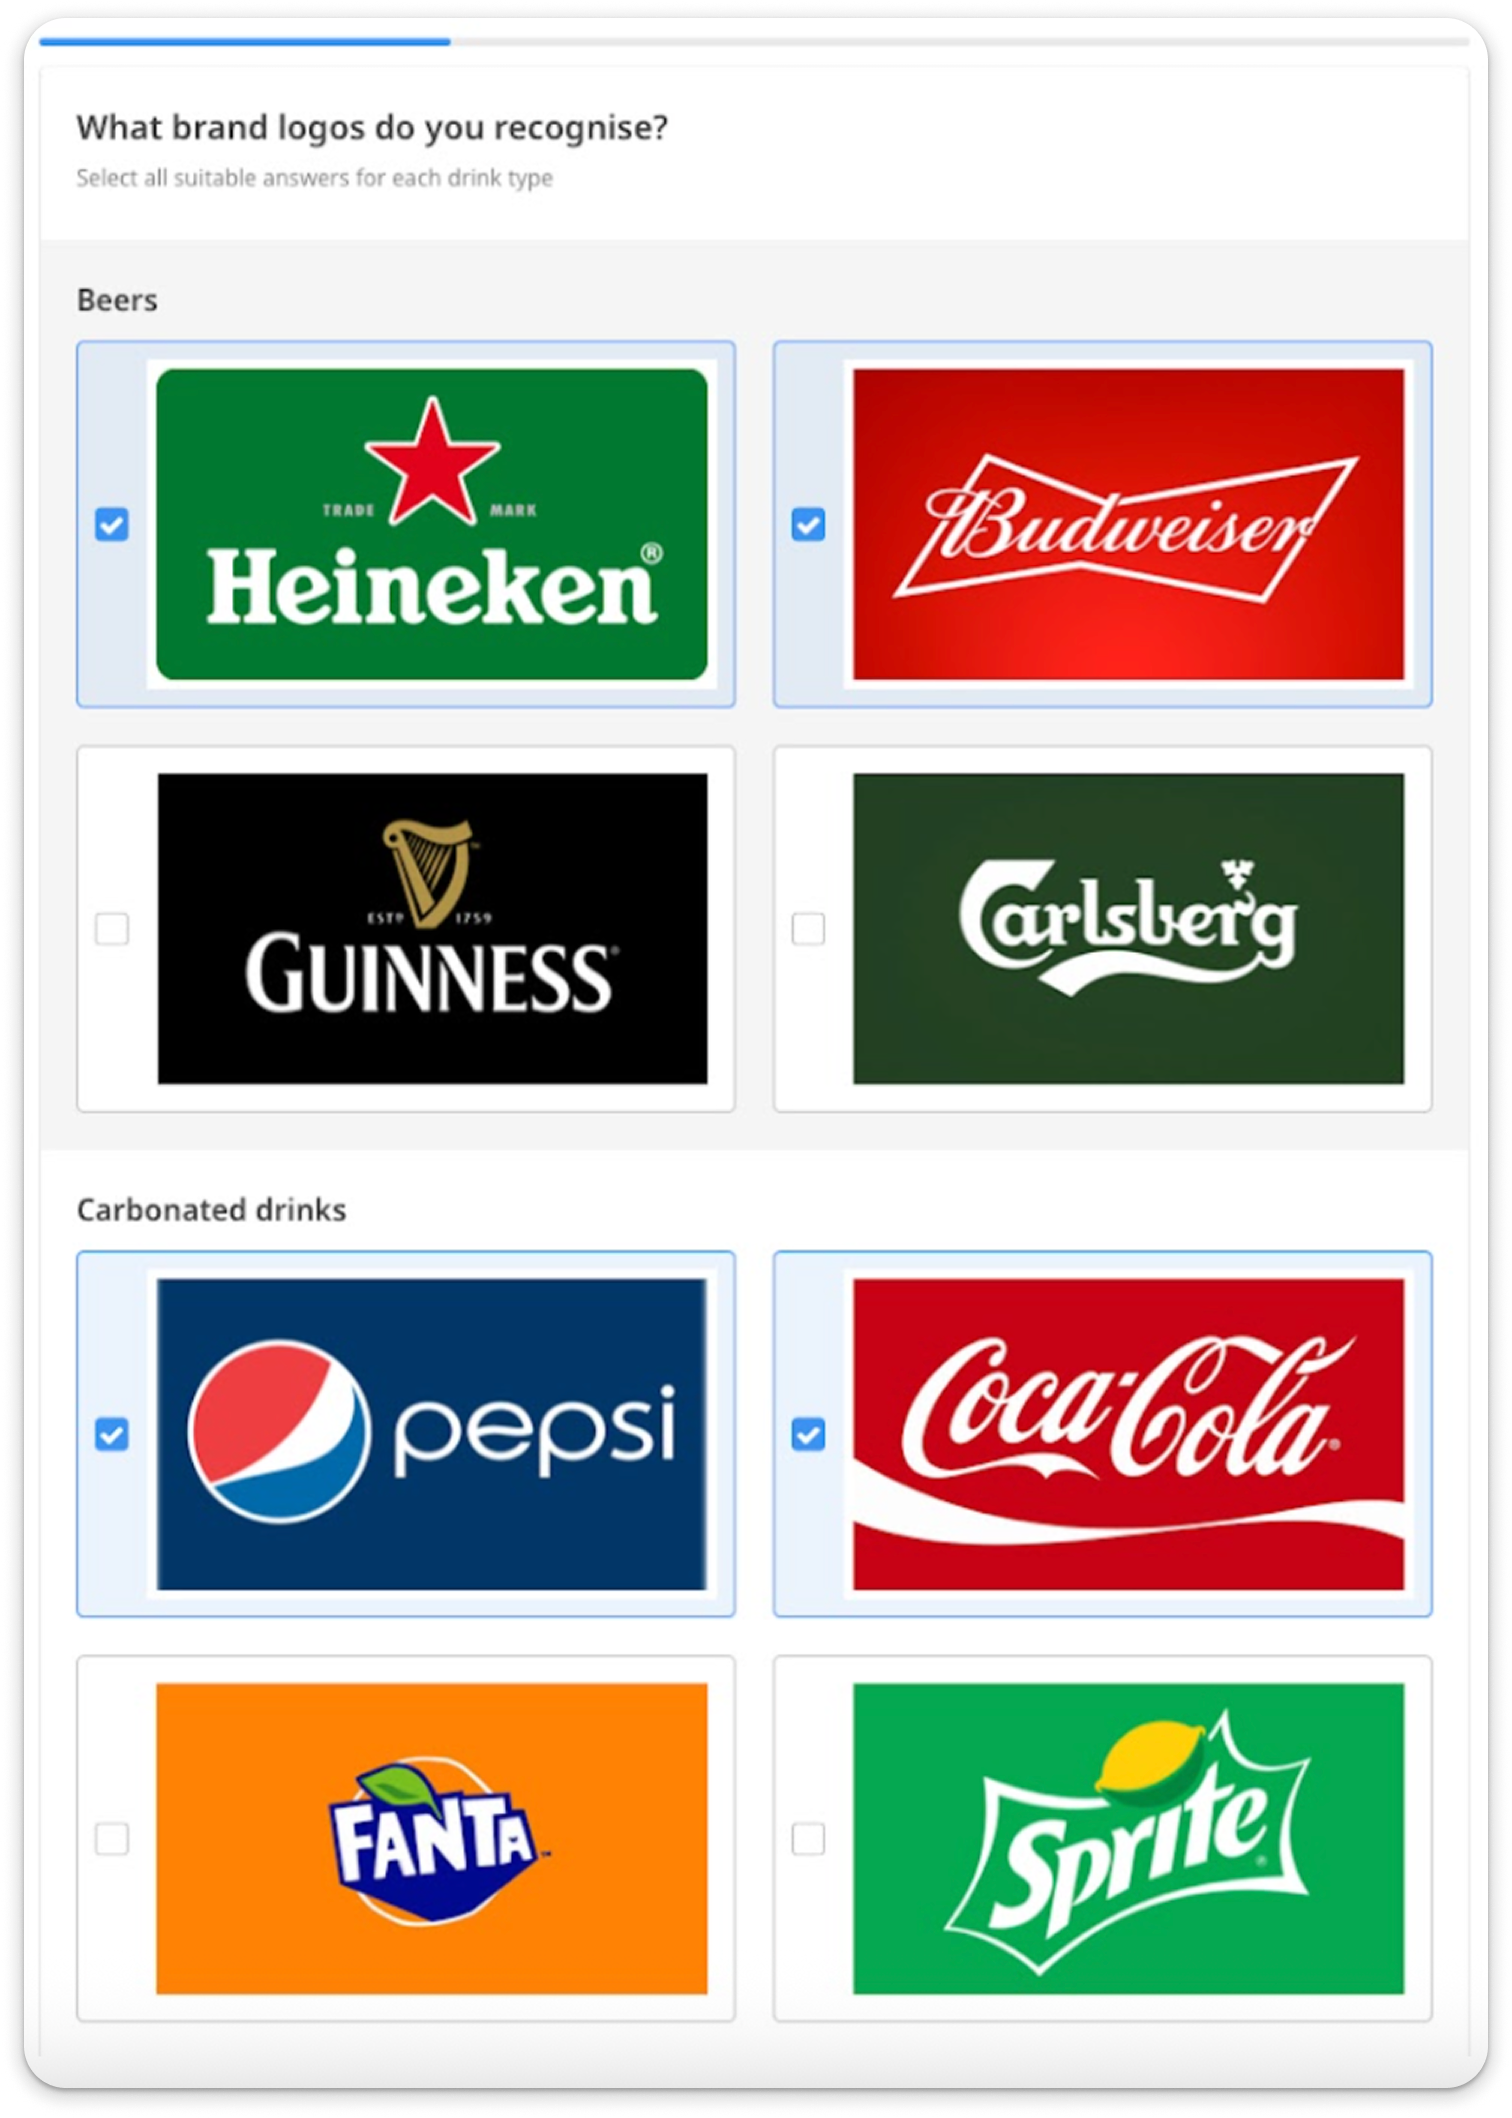
Design consistency examples
|
|
|
|
|
|