Amplify Hub
Overview
Amplify Hub is a dedicated space designed to streamline research launching and analysis for all Amplify solutions. This guide provides an overview of Amplify Hub, its core features, and how to navigate the interface.
Accessing and Navigating the Hub
|
Locating the Hub: You can enter Amplify Hub by clicking the dedicated icon located in the left-hand navigation menu. |
|
|
|
Navigation Context: When opening reports or performing analysis from within the Hub, the left-hand navigation remains accessible, allowing you to return to any section of the Hub seamlessly. |
|
Created by me: Quickly filter your entire Hub homepage to find projects and collections you created by clicking the toggle. |
|

.png)

Launching Projects
Amplify Hub features a unique project creation wizard that differs from the standard platform wizard. The Amplify Hub wizard only displays products that are directly associated with and supported by Amplify Hub. It does not display the entire Zappi product catalog.
|
Quick Access and Searching: Recently used solutions are displayed at the top of the wizard for quick selection, or you can search for the solution you want. Narrow your Options: Apply filters (such as region or country and research type). The list of available solutions automatically filters based on the parameters you select. You can clear these filters at any time. |
|

Alternative Launch Methods
Beyond the Hub wizard, standard project launching workflows remain the same:
- Duplication: You can duplicate existing projects from the Hub interface, which is a common workflow for recurring setups.
- Platform Homepage: Standard methods for launching projects from the main platform homepage are unchanged.
Recently completed ad tests Section
The homepage features a Recent Ads section where you can scroll through a list of your most recent individual ads or surveys. Each item includes a View Report button to open the results immediately.
Toggle to group by projects to see the usual projects view.
Ad Comparison Scale
The Effectiveness Score
All reporting measures are mapped to a standardized, universally interpreted 1-3 scale to simplify cross-asset comparisons:
- 1 - Weak
- 2 - Average
- 3 - Strong
The Effectiveness Score is a common label that allows us to compare ads tested with different solutions. The actual metric powering it depends on the solution the ad was tested with. Because they are all built on the same foundation, they're directly comparable:
| Solution | Underlying metric |
| Amplify TV / Streaming Video & Amplify Digital | Sales Impact score |
| Amplify Early Idea, Storyboard & Boardomatic | Creative Potential score |
| Amplify AI | Creative Power score |
Whatever the label, each of these is derived from the same three foundational pillars, the 3Rs.
The 3Rs Framework
- Reach: Measures how effectively the ad stands out in a cluttered environment, delivers brand linkage, and constructs memory structures.
- Resonance: Evaluates emotional engagement and audience relevance. How heavily the ad connects and stays memorable.
- Response: Measures the ad’s capacity to spark immediate consumer actions, including brand consideration, purchase intent, or reappraisal.
Active Projects
Once a project is launched, its status can be monitored directly from the Active Projects Section on the Hub homepage. You can toggle between Collecting and Draft statuses.

Collections
A Collection is a general, high-level container used to group similar ads together for group analysis. Manage multinational launches, track regional testing over time, or organize ads across solutions into specific campaigns in one place without performing new searches every time. This is the best way to track and review your ad performance across all Amplify testing over time.

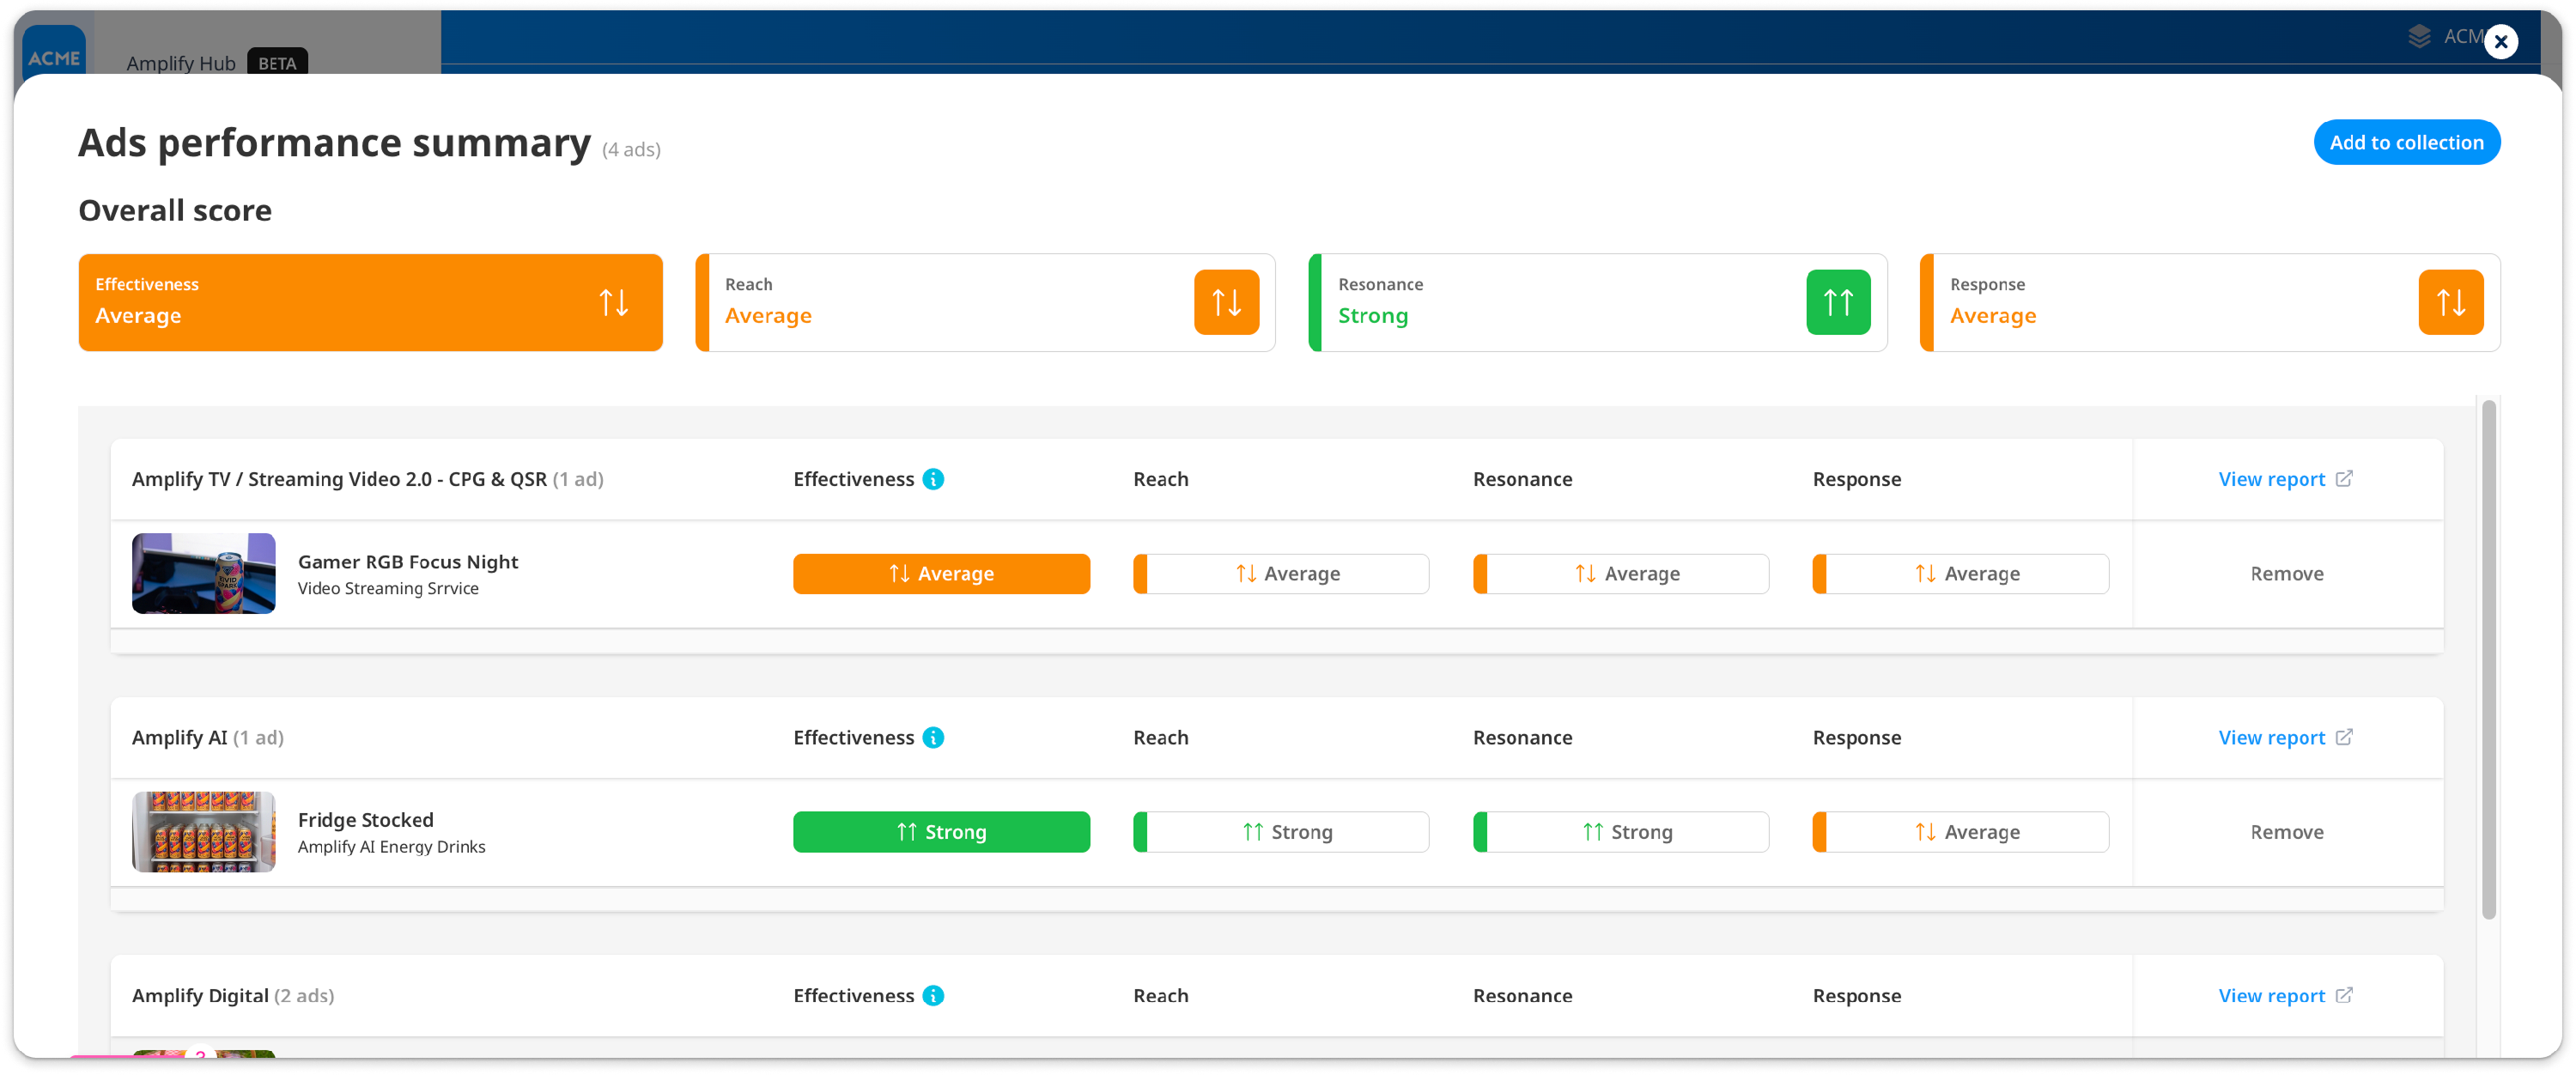
Collection Metrics
Inside a collection, you can view the individual Effectiveness, Reach, Resonance, and Response scores for every ad included. Additionally, an overall Collection Effectiveness Score is displayed, which provides an average score for each metric across the entire group.

Adding Ads to a Collection
You can build or expand collections in two ways.
From the Home Page: In the Collections section, click the “New Collection” button.

From the Ads & Projects Library: Select a group of ads within the Ads Library and clicking the option to add them to a collection.

When managing a collection, you can select more ads to include, or select a subset of the collection to open an Ad Performance Summary for the smaller selection. A collection can hold up to 500 ads.
Collection Permissions and Sharing
- Visibility: Collections are private by default. Users cannot see all collections across an organization; you can only see your own collections or those that have been explicitly shared with you.
- Sharing: When you click the Share button to share a collection with other users, those individuals are automatically granted access to the collection itself, as well as to every underlying project contained within that collection. A warning message appears during the sharing process to clarify that all ads from all projects in the collection will be shared.
- Private Team Spaces: Ads within private team spaces cannot be added to collections at this time. Collections are designed to exist outside of team spaces to allow cross-project mixing, meaning only ads from public team spaces can contribute to a collection.
Ads & Projects Library
The library provides a comprehensive view of your individual assets and overarching projects. Toggle between the Ads view and Projects view.
Ads view
An "Ad" represents a single stim from any survey. The Ads Library offers two viewing configurations:
- Card View: Provides a detailed visual layout showing the overall Effectiveness Score at a quick glance, giving you immediate insight into ad performance.
- Table View: Provides a list view that introduces extra data columns for granular metrics, specifically Reach, Resonance, and Response.
Projects view
Use the toggle at the top of the page to switch to Projects Library.
The Projects Library displays original project containers and includes both a new Card View and the existing Table View. Apply standard filters, such as filtering by completed status, and execute all standard project-level actions.
Analysis and reporting
The analysis and reporting features within Amplify Hub provide a centralized location for reviewing all Amplify project data and evaluating asset performance. Access instant summaries and generate comparative reports directly from the interface.
Quick Reports
When an Amplify project finishes processing, an email notification is automatically sent to you containing a direct link to the results. Clicking this link opens a Quick Report.
Charts and Advanced Analytics
For standard solutions that support complex data layouts (such as Amplify TV / Streaming Video), clicking the reporting button allows you to access your usual deep-dive features directly inside the Hub without being redirected to the main platform analysis pages. These options include:
- Charts and Chart Data
- Advanced Analytics
- Data Export
Multi-Ad Reports (Comparing Ads)
From the Ads Library, you can select multiple ads across different products to run a high-level comparative analysis.
- Ad Performance Summary: Clicking Compare Ads opens a screen that averages your selections to give an Overall Score and automatically groups them based on Quick Report compatibility.
- Compatibility Rules: The system determines what can and cannot be combined into a single report. For example, multiple ads tested with Amplify TV / Streaming Video can be combined into a multi-ad Quick Report or advanced analysis, but they cannot be combined with ads from Amplify Early Idea.
- Retention of Selection: Clicking View Report for a multi-ad analysis opens the report in a separate browser tab. This prevents you from losing your active ad selections and search configurations in the library.