Zappi Amplify Storyboard & Boardomatic
Summary
Zappi Amplify Storyboard and Zappi Amplify Storyboard Boardomatic are part of the Zappi Amplify Ad System. Both are perfect to help you find the best storylines to progress to production and provides rich diagnostics into how to make your ideas even stronger. These solutions help you set your ad up for success and prevents the need for major, costly post-production changes. Designed with the same key metrics framework as Zappi Amplify TV, you can track effectiveness throughout the development stages.
Available for these verticals:
- CPG & QSR
- Tech
- Essential Services (e.g. Telco)
- Financial Services
- Retail
- SMCG
Stimuli:
- If Storyboard: static frame-by-frame storyboard carousel: you can upload 2-10 scenes per project/survey, within the same country and category.
- If Boardomatic: video-based storyboard, typically containing a voiceover of the storyline and/or music.
Evaluation: Monadic
Norms: Yes; market-wide norms are activated when total stimuli tested reaches N=20 and your own customer norm per market activates when you've tested 20 stimuli in each market.
Contents
Getting started
Analysis topics
Key measures
Consistent with the full Amplify ad system's metrics. While it does not have the same later effectiveness summary scoring as Amplify TV or Digital, we introduced the early stage Creative Potential summary score to make analysis easier and more compelling (jump to section). Like all solutions in the Zappi Amplify system, the Zappi Amplify Storyboard & Boardomatic framework is comprised of measures grouped into key ROI-driver areas.
The 3 Rs Framework
The reporting focuses on the storyboard's potential to Reach, Resonate and create the desired Response and the ad's potential is summarized via the Creative Potential Score. The Creative Potential score is a summary measure which looks holistically at the potential of the idea to be translated into a successful finished execution.
Creative Potential is then diagnosed using the 3 Rs - Reach, Resonance and Response. Within your Quick report there are summary scores for each, as well as the ability to see which individual measures are driving the summary score up or down.
- Reach: The ad’s ability to cut through the clutter, link to the brand, and build distinct memory structures making the brand more salient.
- Resonance: The ad’s ability to engage and trigger an emotional response helping the ad go into memory and making it come to mind more positively into the future.
- Response: The ad’s ability to generate a more immediate response and brand reappraisal, more important for smaller brands or news based ads.
The 3 R scores are presented as absolute scores within Quick Reports and Crosstabs. They are also available as percentiles within the Percentile Distribution chart.
Testing process
- You can select between two different versions of Amplify Storyboard based on your preferred stimuli:
- Amplify Storyboard: for static, comic strip style storyboards shown in a carousel. Each storyboard can consist of 2-10 scenes spliced into separate frames/images.
- Amplify Storyboard Boardomatic: for video-based boardomatic stimuli.
- 200 category-consumer respondents are exposed to each storyboard
- Key questionnaire components:
- Uniqueness, relevance, and ability to persuade: Respondents answer questions to gauge your ad idea’s ability to stand out from the crowd and persuade viewers to select your brand.
- Appeal: Respondents are asked to rate how appealing they find your ad idea and answer why.
- Emotional engagement: Respondents are asked to rate which emotions are conveyed by each scene for static storyboards, or second-by-second for video boardomatics.
- Message believability and clarity: Respondents are asked how clearly the stimuli conveys the intended messaging and how believable the messaging is after they’ve been exposed to your stimuli.
Configuration checklist
- Obtain your stimuli:
- If Storyboard: static frame-by-frame storyboard carousel: you can upload 2-10 scenes per project/survey, within the same country and category.
- If Boardomatic: video-based storyboard, typically containing a voiceover of the storyline and/or music.
- Ensure you add the following information to configure your survey:
- Storyboard name: to help you keep track of which stimulus is which in reporting, this will not be shown to respondents.
- Brand name: to feed into survey questions such as brand appeal, brand usage, etc.
- 8-10 Brand/category attributes: to see which attributes respondents associate with your stimuli. We recommend entering 8-10 attributes, but the platform can accommodate 15.
- 255 character limit, per attribute
- 1-4 key messages for your stimuli: to see which messages respondents find believable after viewing your stimuli and which they think are clearly conveyed.
- Names of any celebrities, characters, or personalities in the storyboard: to feed into survey questions to assess appeal, awareness, and fit with your brand.
Storyboard stimuli preparation guidelines
- Do not exceed 10 pages to avoid respondent fatigue.
- Focus on communicating story flow, dialogue and action notes to establish whether the overall ad idea
- Don’t explain meanings. Just write what is happening in the scene visually. (Say “Fruits start moving” instead of “Fruits come alive”)
- Include key lines from the script, brand assets, product imagery, and characters or celebrities, notations about music and/or sound effects
- If there are celebrities, write their names. Don’t rely on drawing alone
- You may add sound bubbles or write the sound as a text as in comic books.
- Try to explain the type of music used (soft, fast, energetic, pop music, jazz, etc) and underline if music intensifies, slows, etc.
- Specify the language of the song to be used, especially if the language is not the local language.
- Make sure that the drawing style between the ads tested within a single project is similar as they will be compared directly to each other.
Creative potential
What is the Creative Potential score?
- Reach people by breaking through the clutter and bringing the brand to mind
- Resonate to hold attention, be relevant, relatable and make people feel good
- Create a response by making people more likely to consider and feel good about the brand.
How is the Creative Potential score calculated and displayed?
| Area of effectiveness framework | Measure | Weighting |
| Reach | Branding (uniqueness of branding) | 12.5% |
| Reach | Claimed attention | 12.5% |
| Resonance | Overall emotion | 25% |
| Resonance | Relevance | 12.5% |
| Resonance | Understanding | 12.5% |
| Response | Persuasion | 12.5% |
| Response | Brand Appeal | 12.5% |
How should the Creative Potential score be used?
- Take a holistic view on the potential of an idea or storyline
- Compare the creative potential of storylines to decide which to progress
- Learn. Having a single holistic measure of creative potential enables you to explore the characteristics of the best/worst ideas, helping you learn over time and set future ideas up for success.
- Know whether the idea is understood as intended (because if not, the evaluation won’t be helpful)
- Diagnose what is working or not so you get hints, tips, ideas on how best to bring the story to life in an ad.
Why is the Creative Potential score useful?
How does the Creative Potential score relate to the sales/brand impact scores used in later stage Amplify TV and Amplify Digital?
Has the Creative Potential score been validated?
It has not been validated to in-market outcomes as there’s such a big difference between the ideas and the executions that finally bring that idea to life. But on average, an idea/storyboard with a better Creative Potential score results in an ad with high sales/brand impact. It won’t always be the case of course as execution really matters …. But there’s a relationship.
More info on individual charts:
Reason for Emotion: Scene by scene emotions, broken down into individual responses for a granular view of the reasons behind respondents' answers [Storyboard].
Interpreting data and taking decisions
There are a number of different comparisons and decisions people want to make when pre-testing ads. Most brands need at least some media support, so ‘using nothing’ is often not an option. Therefore, common decisions people need to make are:
- Is this ad/are any of my ads strong enough for good ROI?
- Is/are the ad(s) good or great?
- Which execution(s)/creative route(s) is/are strongest?
- Is this new ad stronger than the most recent advertising I’ve invested in? Is this new ad stronger than my competitor’s ad?
- Which iteration of the ad is strongest? (recommended for meaningful differences between creative, not small iterations)
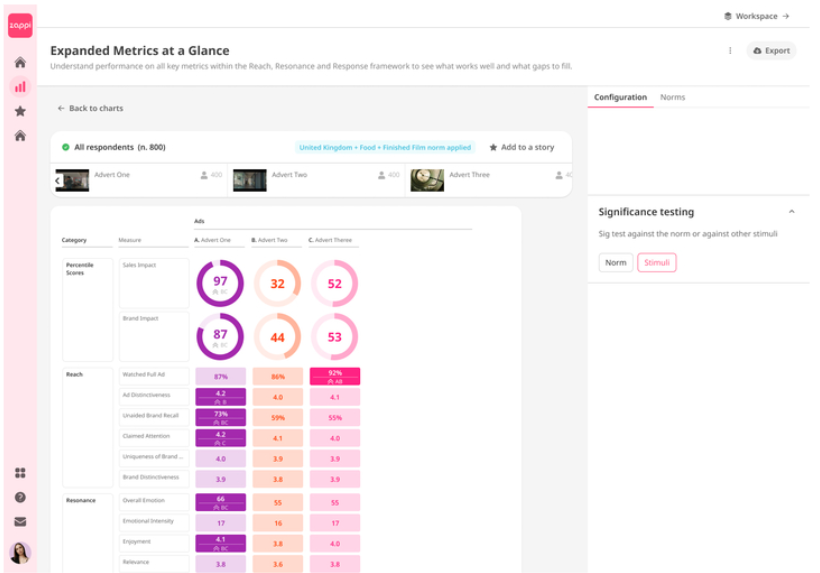
Within the platform there are two different analysis routes that enable you to do all of the above and there is a simple toggle available on the right hand side of the page called ‘significance testing’ so you can switch between them. You should toggle to ‘Norm’ for ‘Questions 1 and 2 (comparing to a norm). You should toggle to ‘stimuli’ to sig test between the chosen ads and answer questions 3-5.
How does the ad to ad comparison work?
The ad to ad comparison sig tests between all the stimuli on each measure.
- Where a measure for a specific ad is significantly above another ad, the colour will be bolded to draw attention to this strength
- And then in place of showing the norm under the achieved score, there is a letter which denotes which column (ad) this ad is stronger than (is for example it says B, it means the ad in this column is stronger than the ad in column B).
- For sales/brand impact, you will still see the percentile score for each ad but we are using the absolute sales/brand impact score (from which the percentile is calculated) to inform whether one ad is significantly above another on the summary metric.
To learn more about taking decisions with Amplify, read here.
Interpreting cultural sensitivity
Why measure it
It's crucial to approach the interpretation of sensitive or potentially offensive content with empathy and cultural awareness. This type of feedback is largely subjective, but by actively engaging with the feedback and striving to stay attuned to cultural nuances, you can refine your advertising to better align with the values and expectations of your audience, thus building trust and equity for your brand.
Jump to read our full best practice advice.
Interpreting results and generating reports
AI-Generated Reports
AI Quick Report: Automated reporting is available upon the completion of a survey which provides a concise summary of results and diagnosis of why. It is produced by combining human expertise in how to interpret and diagnose consumer responses from your survey with AI.