Amplify TV / Streaming Video | Reporting and Analysis
Overview
There are a number of different comparisons and decisions people want to make when pre-testing ads. Most brands need at least some media support, so ‘using nothing’ is often not an option.
There are two ways to analyze your TV or streamed video ad. You can compare against a norm, which is the default view for any chart, or you can compare to another ad.
Compare to the norm:
- Is this ad strong enough for good ROI?
- Is the ad good or great?
Compare to other ads:
- Which executions or creative routes are strongest?
- Is this new ad stronger than the most recent advertising I’ve invested in? Is this new ad stronger than my competitor’s ad?
- Which iteration of the ad is strongest? (recommended for meaningful differences between creative, not small iterations).
To compare two or more ads
From the Analysis section, select two or more ads to compare. You can only compare ads tested in the same market.
Additional comparison options are available within Amplify Hub.
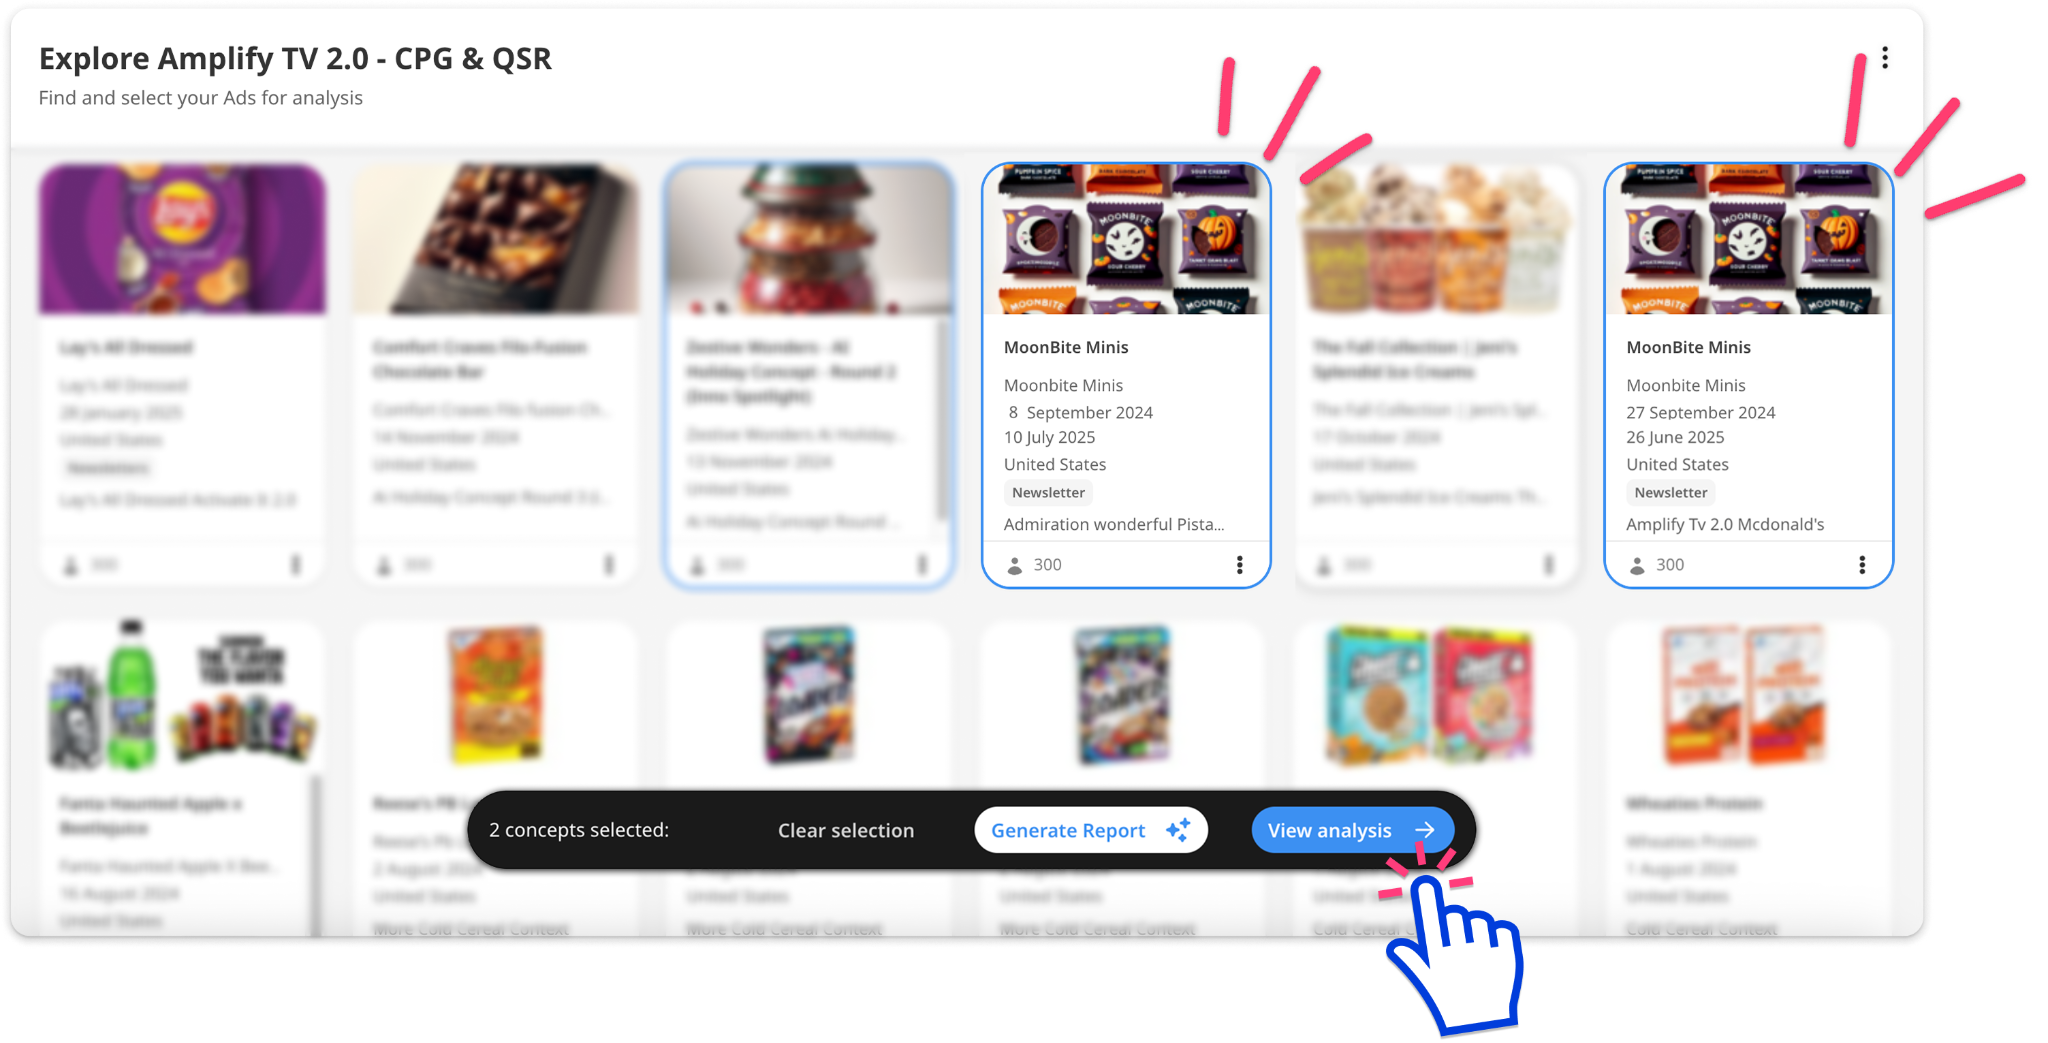
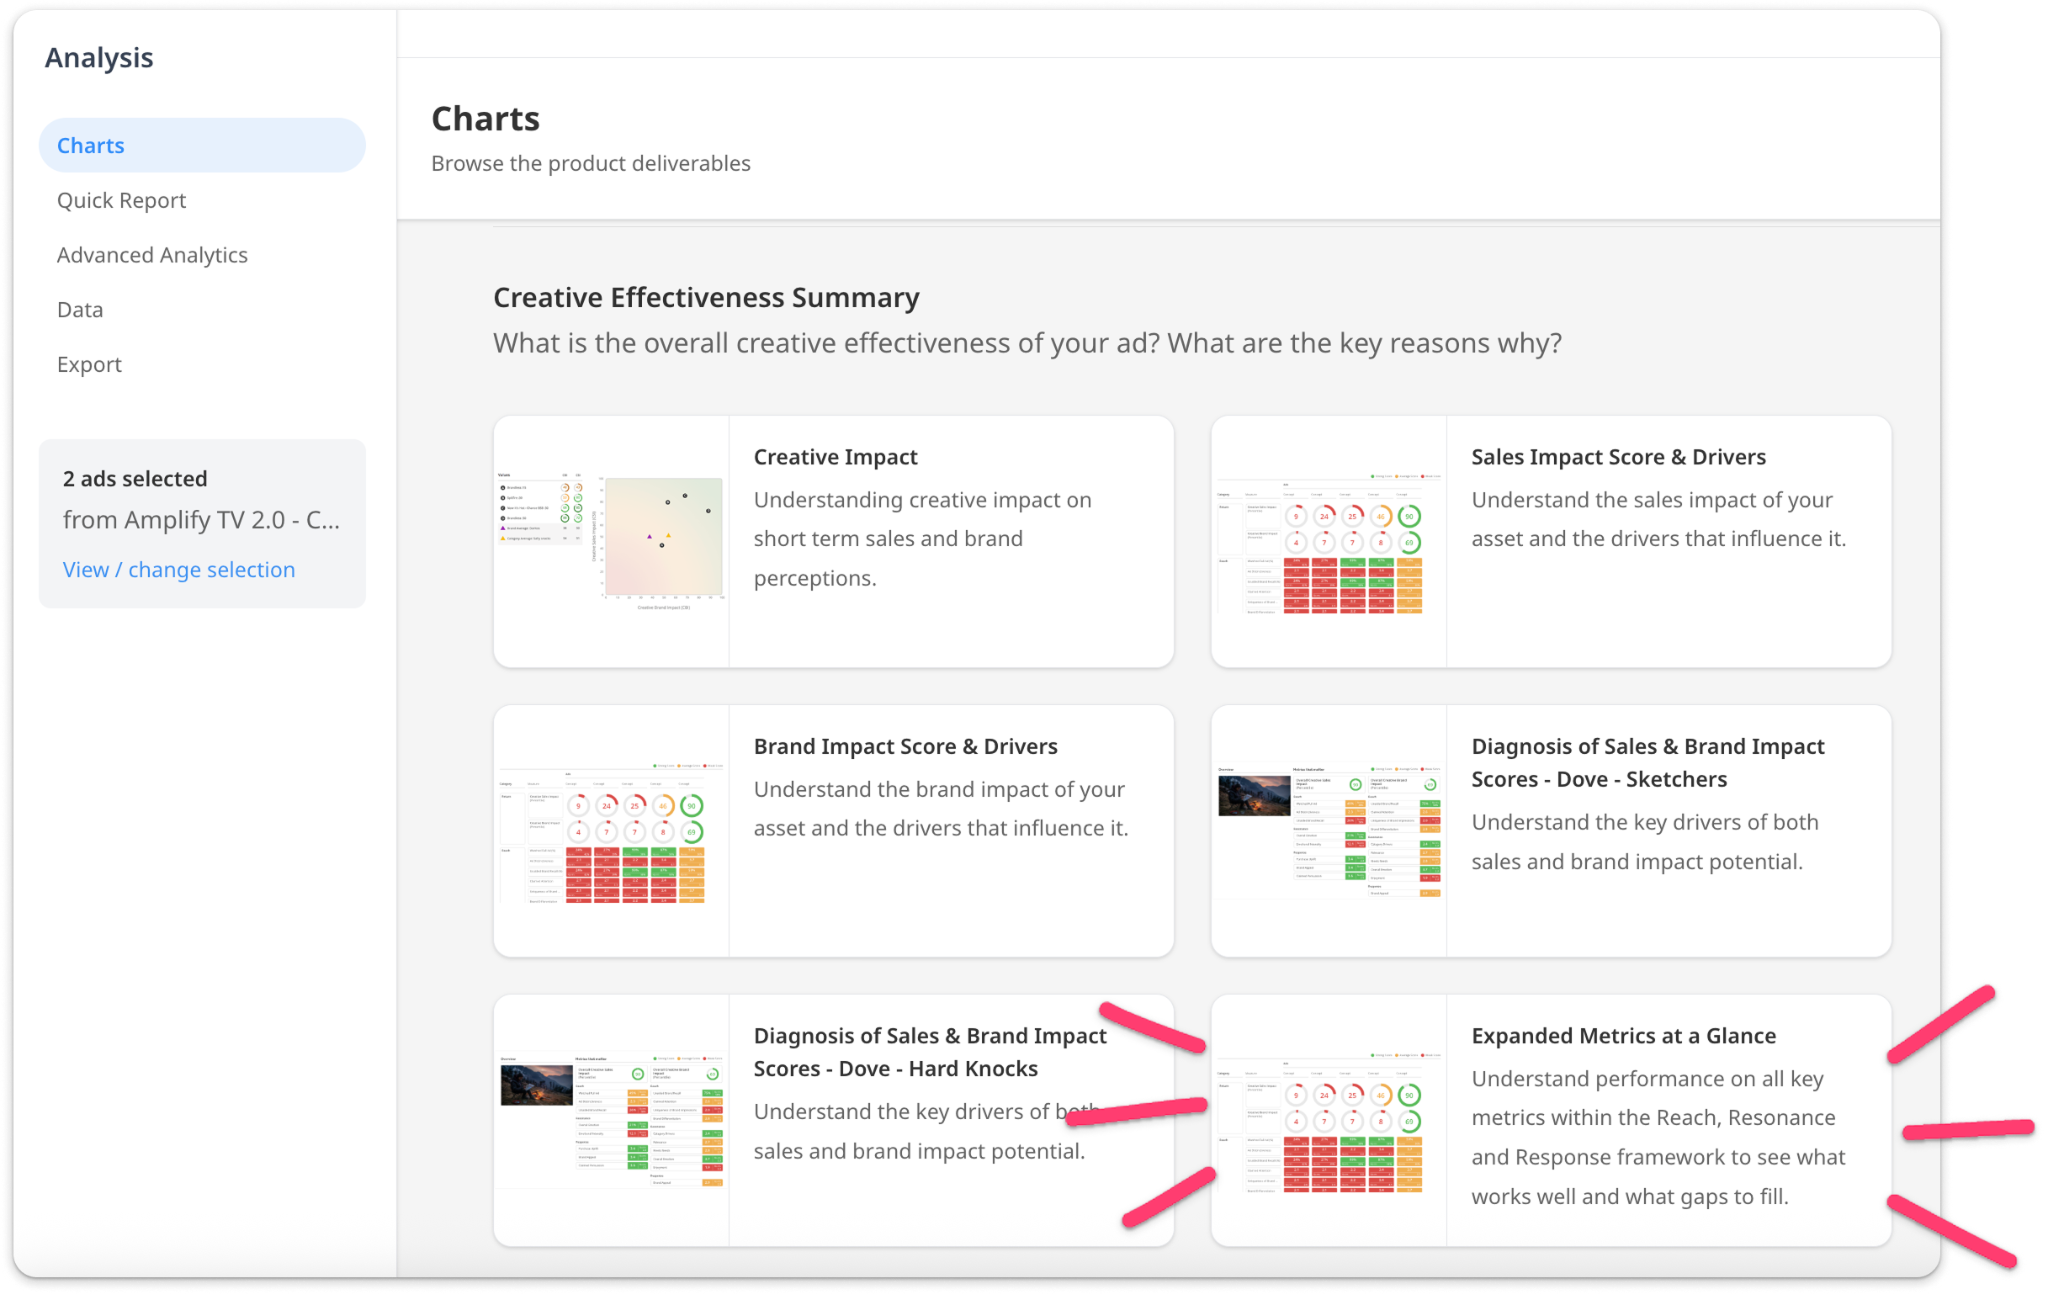
Click ‘view analysis’. Select the Expanded Metrics at a Glance chart.
Charts default to comparing to the norm. To compare the ads to each other, go to the configuration settings on the right and under ‘Significance Testing’ select ‘Stimuli’
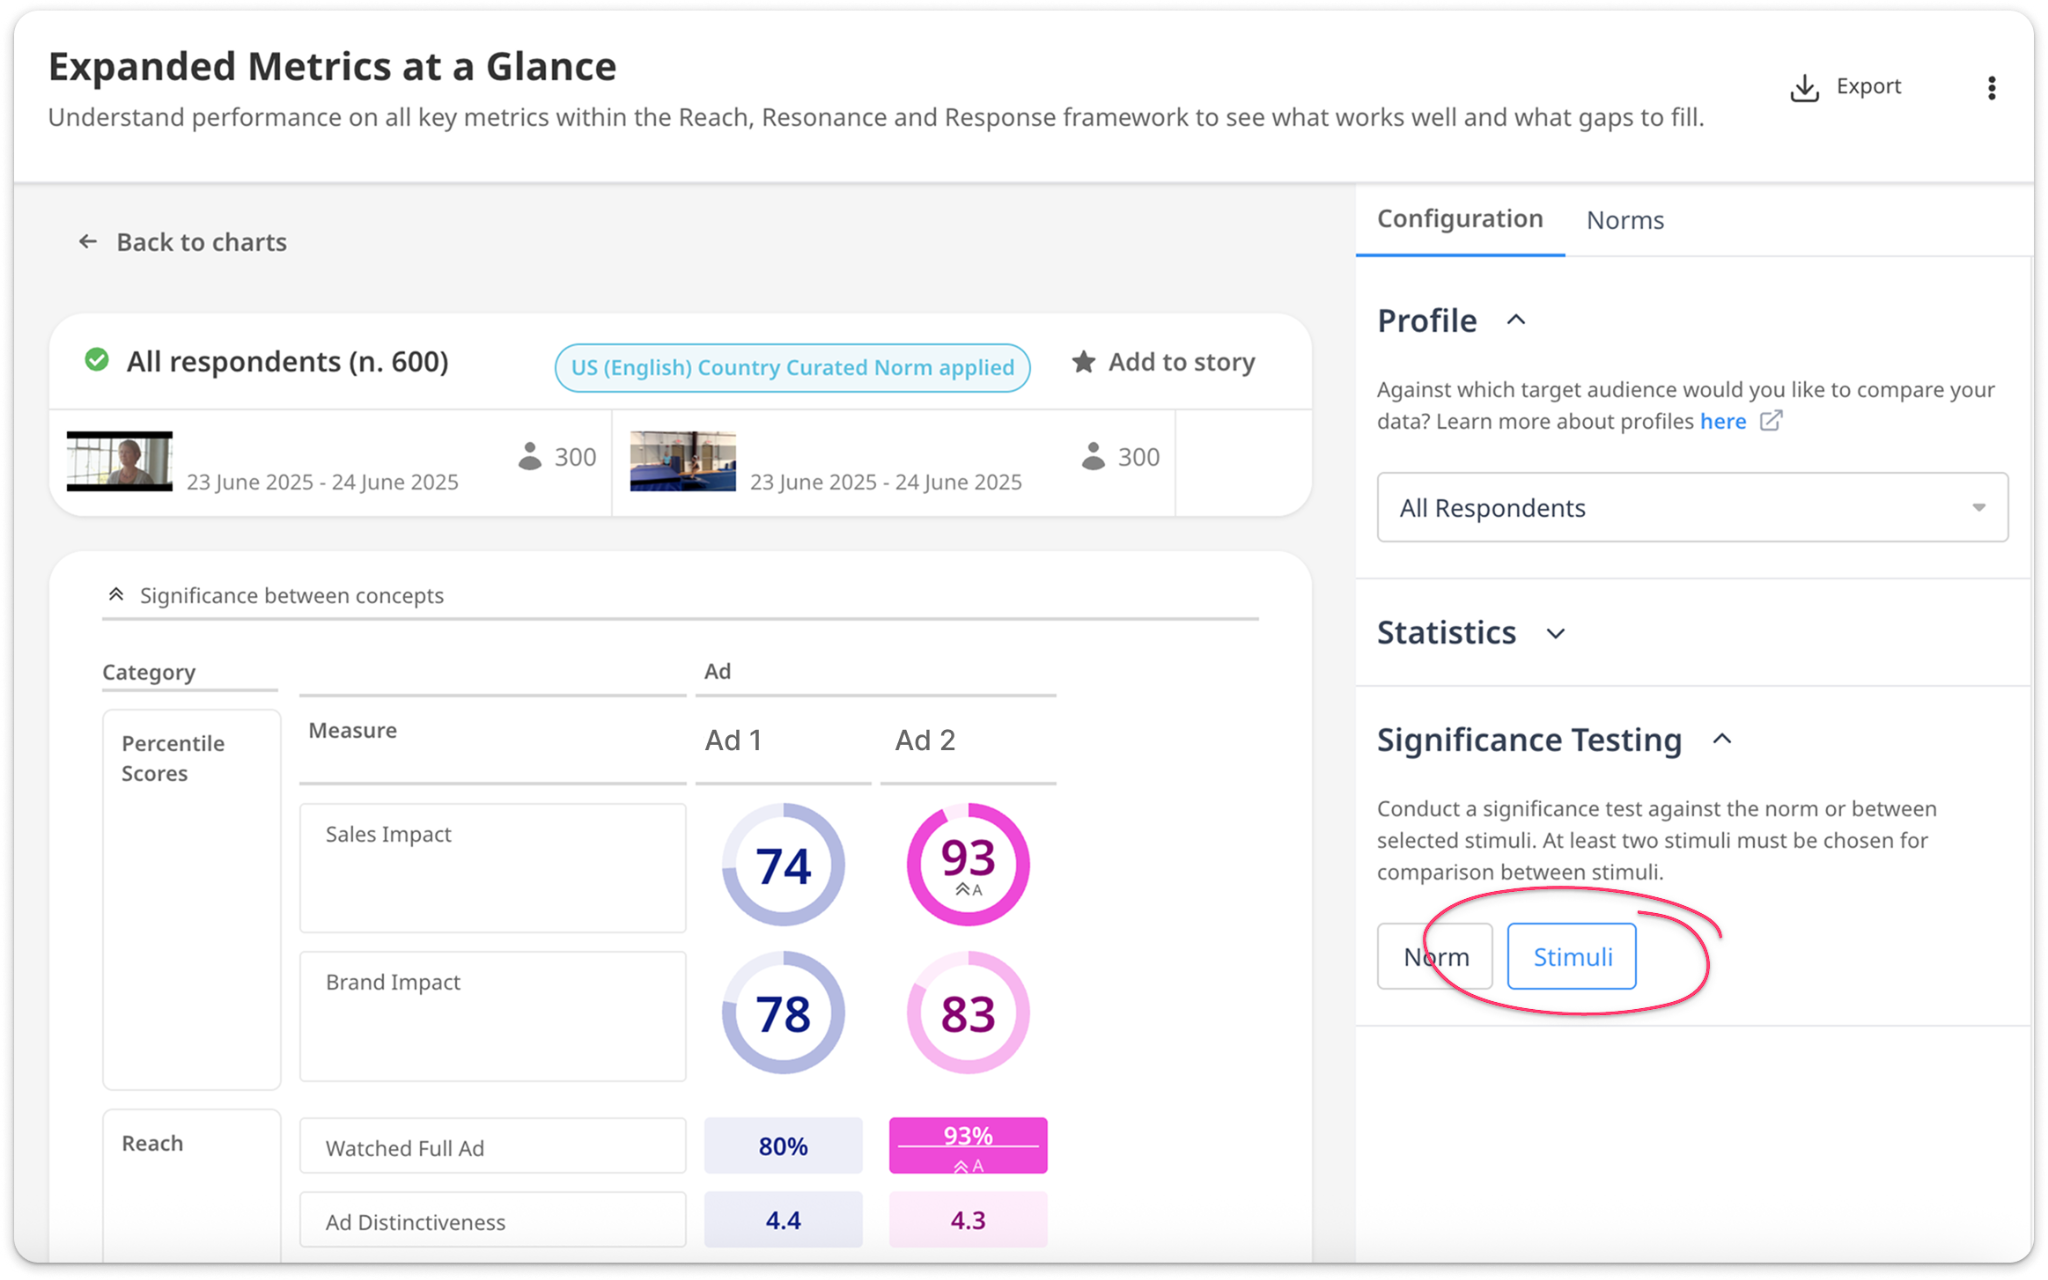
The ad to ad comparison significance test shows differences between all the stimuli on each measure.
- Where a measure for a specific ad is significantly above another ad, the color is bolded to draw attention to this strength.
- In place of showing the norm under the achieved score, there is a letter which denotes which column (ad) this ad is stronger than (for example it says B, it means the ad in this column is stronger than the ad in column B).
- For sales/brand impact, you will still see the percentile score for each ad but we are using the absolute sales/brand impact score (from which the percentile is calculated) to inform whether one ad is significantly above another on the summary metric.
Learn more about making decisions with Amplify.
Quick ReportsAI
Amplify TV / Streaming Video supports Quick ReportsAI. Automated reporting is generated upon the completion of a survey which provides a concise summary of results and reasons. It’s produced by combining human expertise in response interpretation and diagnosing consumer responses from your survey with AI.
Select one or more projects, then click ‘Generate Report’ to get a clean, editable analysis of your data. Learn more about Quick ReportsAI.
Important Note
The Quick ReportAI is a snapshot using the norm available when your survey was completed. If you re-analyze your data later, numbers may differ because you selected a different norm or the original norm has been updated with new survey data.
Profiles
Profiles allow you to filter your survey results by pre-grouping segments into a single click. For example, a Profile might be “All adults under 55”.
When you select a Profile, it filters the entire dataset using the chosen demographics. So if you choose a profile for males, Reporting shows a norm based on all male respondents.
Profiles and the norms they reference are tied to the category. A profile created for "Beer" could not be applied to "Spirits". If you want to analyze multiple categories, you will need to test consistently in each category to create a separate profile for each.
Cultural Sensitivity Question
You can choose to add the Cultural Sensitivity question during configuration. This can give you some insight into how consumers view your product or idea, and allows you to catch any issues before you go to market.
Learn more about the Cultural Sensitivity Question and how to interpret the results.