Screen It
Screen It is an early-stage screening tool for testing product ideas, logos, names, designs and more. It allows you to identify the ideas that work for your audience and optimize the best ones with consumer insights. It is part of the Zappi Innovation System so once you use Screen It, you can evolve your ideas further and iterate with consumers using our advanced concept testing tools such as Activate it Early, Activate it, based on the same framework.

Contents
- Jump to information below:
Screen It 2.0
Key Details
Screen it 2.0 is a sequential test, meaning that consumers will be comparing each of the items that are tested against each other instead of evaluating each item individually on its own merits. With Screen it, you may:
- Test a variety of ideas in 50+ markets within as little as 5 hours
- Screen up to 60 items (depending on market feasibility)
- Test a wide variety of stimuli, including early product ideas, logos, names, claims in image and text format
- Sequential ranking on chosen measure for easy insights-driven decisions - ability to choose from 10 key measures to rank on
Additional metrics measured on a scale of 1-5 to help you understand potential of your ideas:
- The key Zappi Innovation Framework metrics:
- Behavior change (with the option to select what behavior you want to drive - e.g. purchase, consideration, usage)
- Distinctiveness
- Advantage
- Additional metrics & diagnostics:
- Relevance
- Believability
- Attribute association
Configuration
Easy Configuration
Our new configuration journey makes the set up process more streamlined, saving you time. We have a dedicated article on the new configuration, available here.
Note: if needed, you still have the option to access the old configuration journey.

Configuration Checklist
- Audience: Custom Audience or Zappi Audience selected (list of available Zappi Audiences can be found on the platform)
- Stimulus/stimuli: JPG/PNG (max 800 PX high by 1366 PX wide) or text (250 characters max)
- Survey introduction statement: Short introduction (1000 characters max) of what the survey is about (i.e., "You are about to evaluate logos for a new brand.")
- For non-English markets, the statement needs to be in the local language
- You also have the option to upload an image or video in addition to your intro statement
- Which measure you would like to have respondents rank on - options include:
- Appeal: Out of the following [stimuli type], which one do you find most appealing?
- Behavior Change: Out of the following [stimuli type], which would you be most likely to [action]?
- Believability: Out of the following [stimuli type], which one do you find most believable?
- Distinctiveness: Out of the following [stimuli type], which do you find most distinctive?
- Fit with Brand Impressions: Out of the following [stimuli type], which one fits best with your impressions of the [noun]?
- Impact to Appeal: Out of the following [stimuli type], which one would make the [noun] most appealing?
- Impact to Behavior Change: Out of the following [stimuli type], which one would make you most likely to [action] the [noun]?
- Impact to Distinctiveness: Out of the following [stimuli type], which would make the [noun] most distinctive from others that you are aware of?
- Meets Needs: Out of the following [stimuli type], which one meets your needs the most?
- Relevance: Out of the following [stimuli type], which one do you find most relevant?
- Optional measures: Which will you be including in your project?
- Attribute Association, Behavior Change, Distinctiveness, Advantage, Relevance, Believability,
- For attributes, you may include up to 20 in total
- You will have a list of attributes to choose from, which for non-English markets are available to you already translated. You can use your own custom attributes, but you will need to provide translations for non-English markets
- You can use your own custom attributes, but you will need to provide translations for non-English markets
- Open ended diagnostic options when testing Images: You have an option to choose autocoded and charted verbatims for your likes & dislikes questions, or heatmaps.
- Custom questions (optional): at an additional cost per question. You will need to provide translations for non-English markets. Questions can take the following forms:
- Grid
- Scale
- Open end
- Multiple choice
- Single choice
Pro tip! Custom questions in ScreenIt allow you to pipe in stimuli to the rows of a grid question, allowing you to get more precise answers from respondents about your ideas. When adding a custom grid question during configuration, use this toggle:

Add Consultancy
You can choose to get help with the analysis after your survey by requesting a consultant. You can choose the number of stimuli you want to be analyzed. The pricing is a tiered system, so the price adjusts for every 5 stims added.

Selecting Stimulus Type
When configuring your test you will be asked to select the type of stimulus you are testing. You will see a pre-determined list of stimulus type, and it's important that you select the most relevant descriptor of your stimulus from the drop-down list:
- Concept
- Design
- Idea
- Message
- Name
- Product
Use the following grid to map your stimulus to the most relevant stimulus type:
| Design | Concept | Message | Idea | Product | Name |
| Design | Concept | Message | Idea | Product | Name |
| Logo | Flavor | Claim | Innovation idea |
|
|
| Image | Flavour | Advert | Offer |
|
|
| Packaging |
|
Statement | Promotion |
|
|
| Package |
|
Tagline | Partnership |
|
|
| Pack design |
|
Advertisement | Product idea |
|
|
| Pack |
|
Digital ad |
|
|
|
| Package design |
|
Tweet |
|
|
|
| Packaging design |
|
Headline |
|
|
|
Questionnaire Flow and Key Metrics
- Ranking. A respondent will see a maximum of five (5) items that are tested. Respondents rank each of the items that they have been shown. They will see all five stimuli individually to begin, and will see them displayed together towards the end of the test as well.
- Optional Measure Questions. One to six Optional Measures questions can be selected for the respondent to react to:
- Attribute association
- Behavior change
- Distinctiveness
- Advantage
- Relevance
- Believability
- Diagnostic options:
- Open ended likes & dislikes: respondents are asked to provide open ended feedback on what they liked and what they disliked about the items they rated the highest and the lowest.
- Heatmaps: respondents are shown the items that they rated the highest and the lowest. They'll click on the areas that they like the most and the least and add open ended feedback.
Reporting
AI Quick Reports
AI Quick Reports is an auto-generated report available with the click of a button upon the completion of a Screen it survey. It provides a concise summary of results and diagnosis of why across the multiple stimuli tested - and is produced by combining human expertise in how to interpret and diagnose consumer responses from your survey with AI.
Standard Reporting
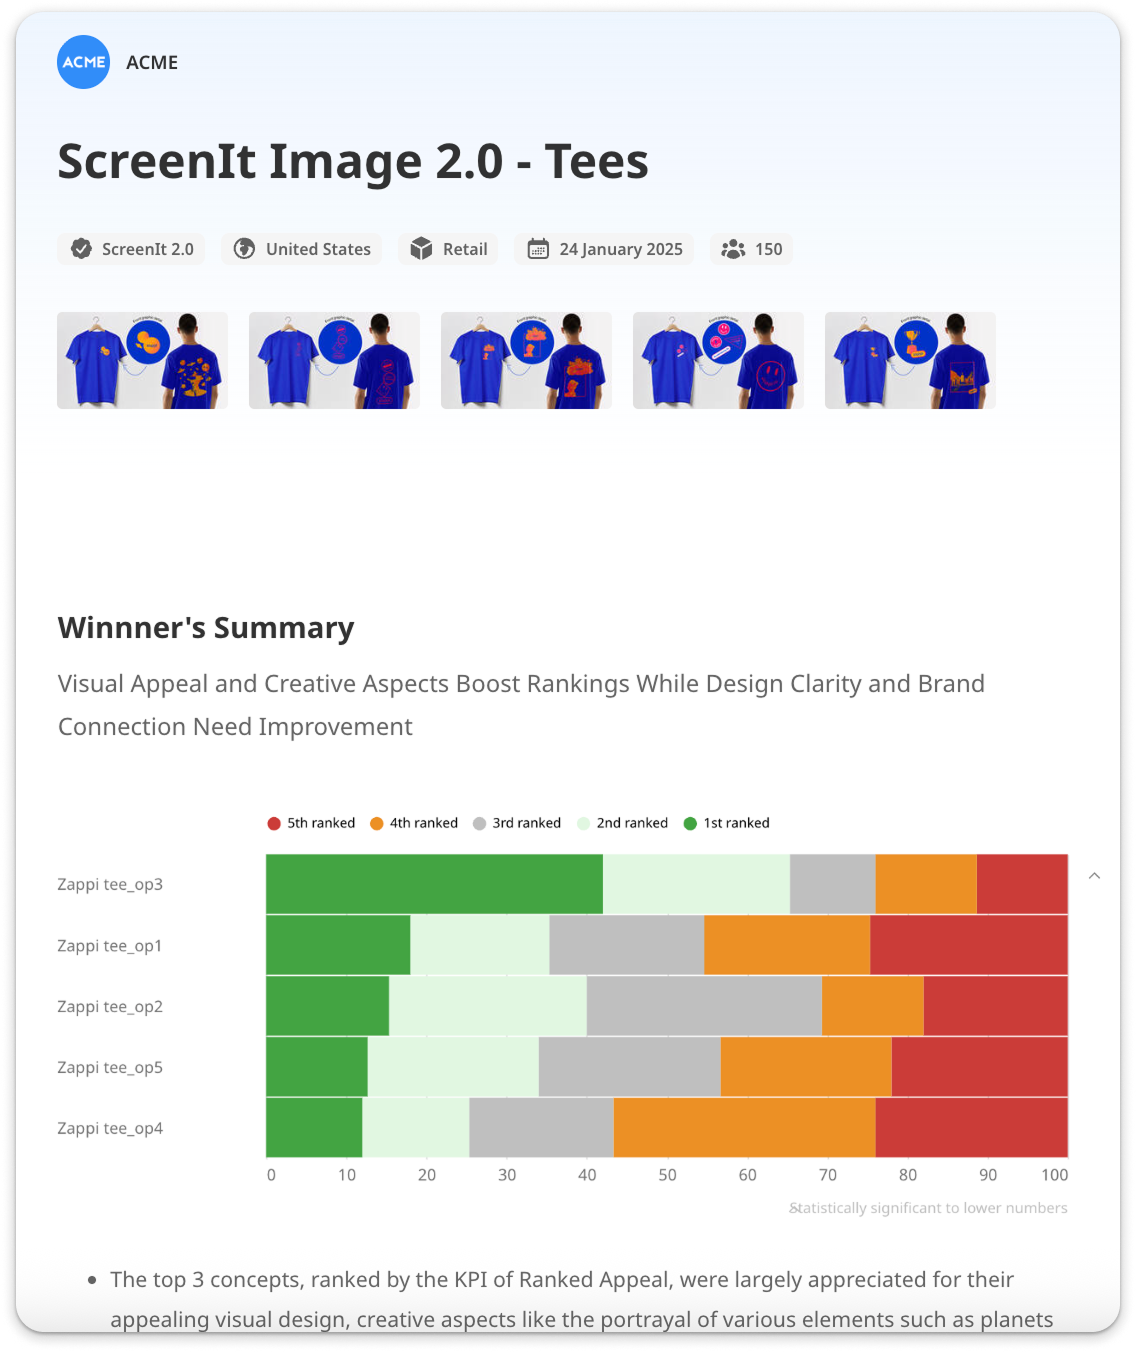
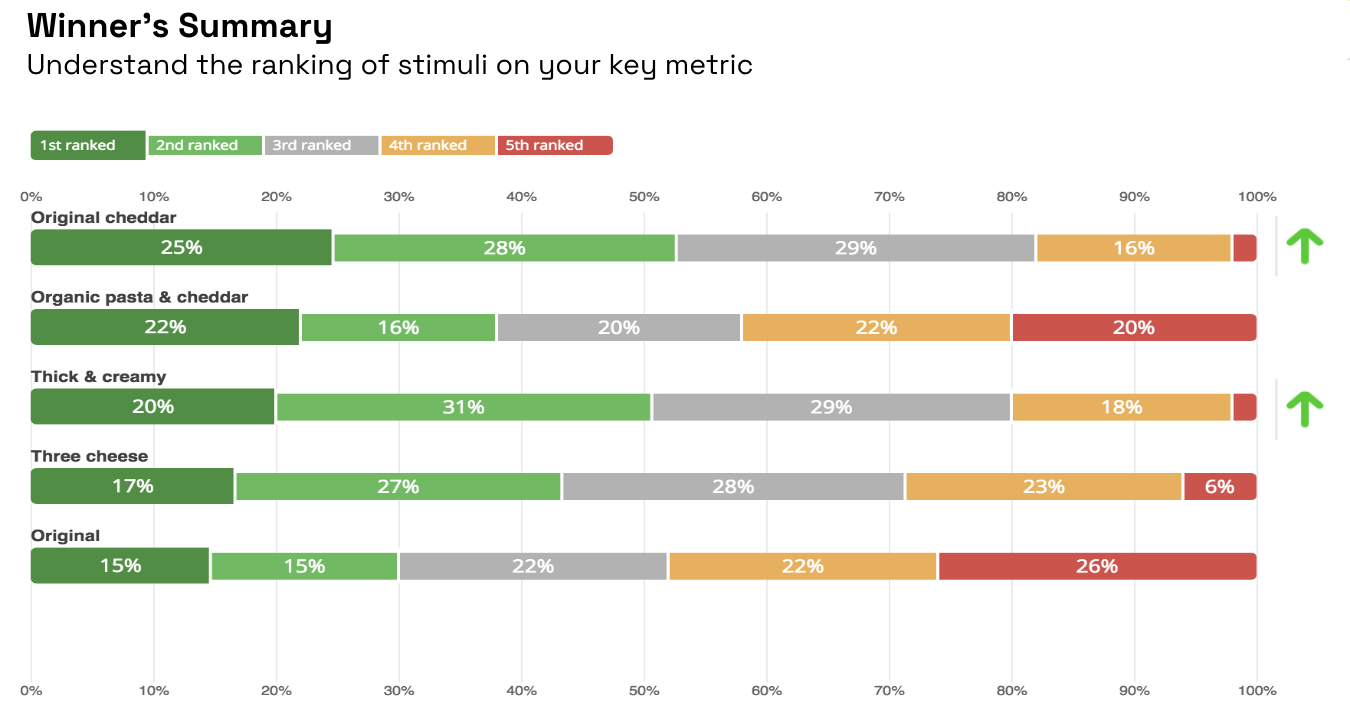
The Winners’ Summary: A digestible view of how each idea performs / ranks based on their rating for the selected key measure.
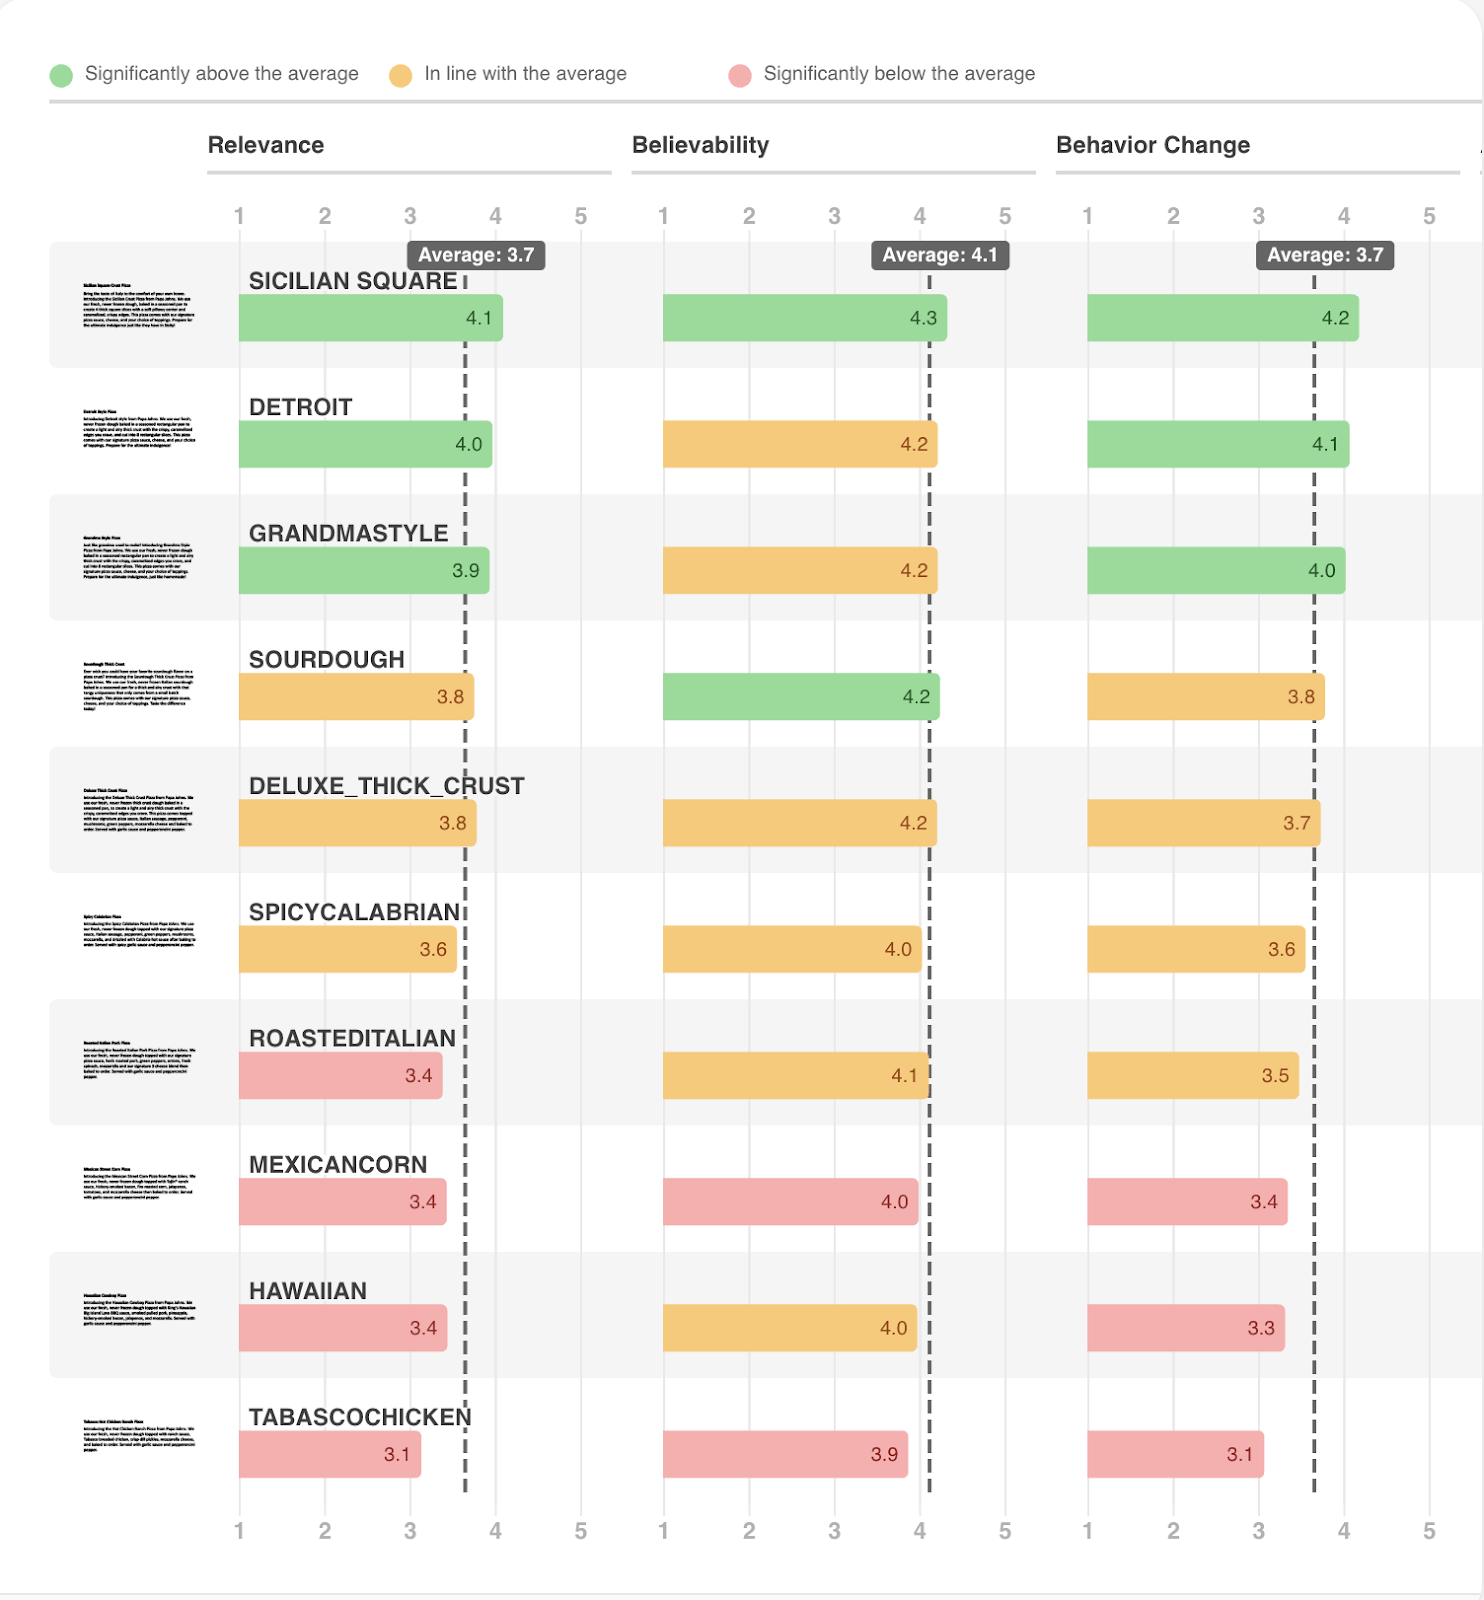
Optional Metrics: Choose a number of key metrics important to you and get a comparison of how each of your ideas is rated on these metrics. The optional metrics include Behaviour Change, Distinctiveness, Advantage, Relevance, Believability, and Attributes.
Heatmaps: Instantly see which areas of the top ranked stimulus is most and least liked and explore open ended feedback behind each of the areas.

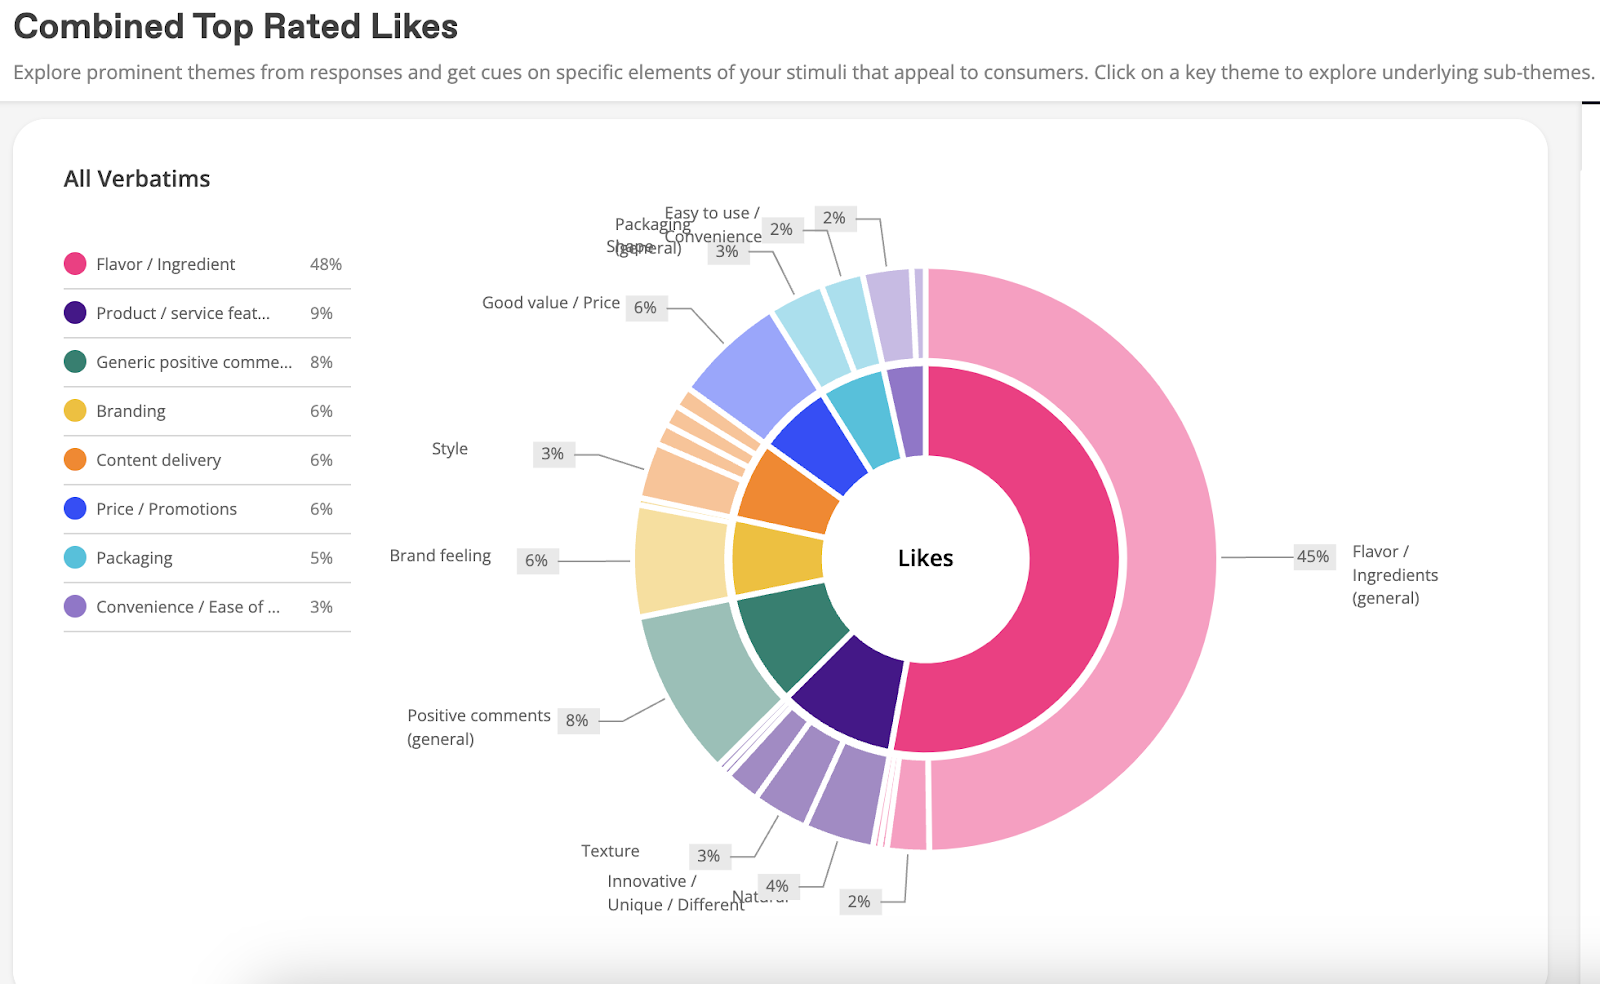
Autocoded verbatims: The AI-based autocoding of verbatims creates a powerful interactive chart. This enables you explore the most prominent topics from responses to open-ended questions (likes & dislikes)